

Where did we come from?
The history of Britain’s population is all about arriving, staying and settling, or leaving, moving and settling elsewhere. People from continental Europe began to settle in different parts of Britain after the last Ice Age, around 12,000 years ago. Ever since, these islands have been continuously occupied as new arrivals mixed with existing residents.
Until recently we had only tantalising postcards from the past, in the form of archaeological finds and much later written accounts, to tell the stories of the early arrivals. Our family journeys are written in our genes, and now genetic analysis can provide new clues to our diverse origins. Geneticists are working side by side with geographers and archaeologists to piece together the evidence of Britain’s earliest occupants.
The story continues in modern Britain, as people come from every corner of the globe to settle in their turn.


The first people in Britain
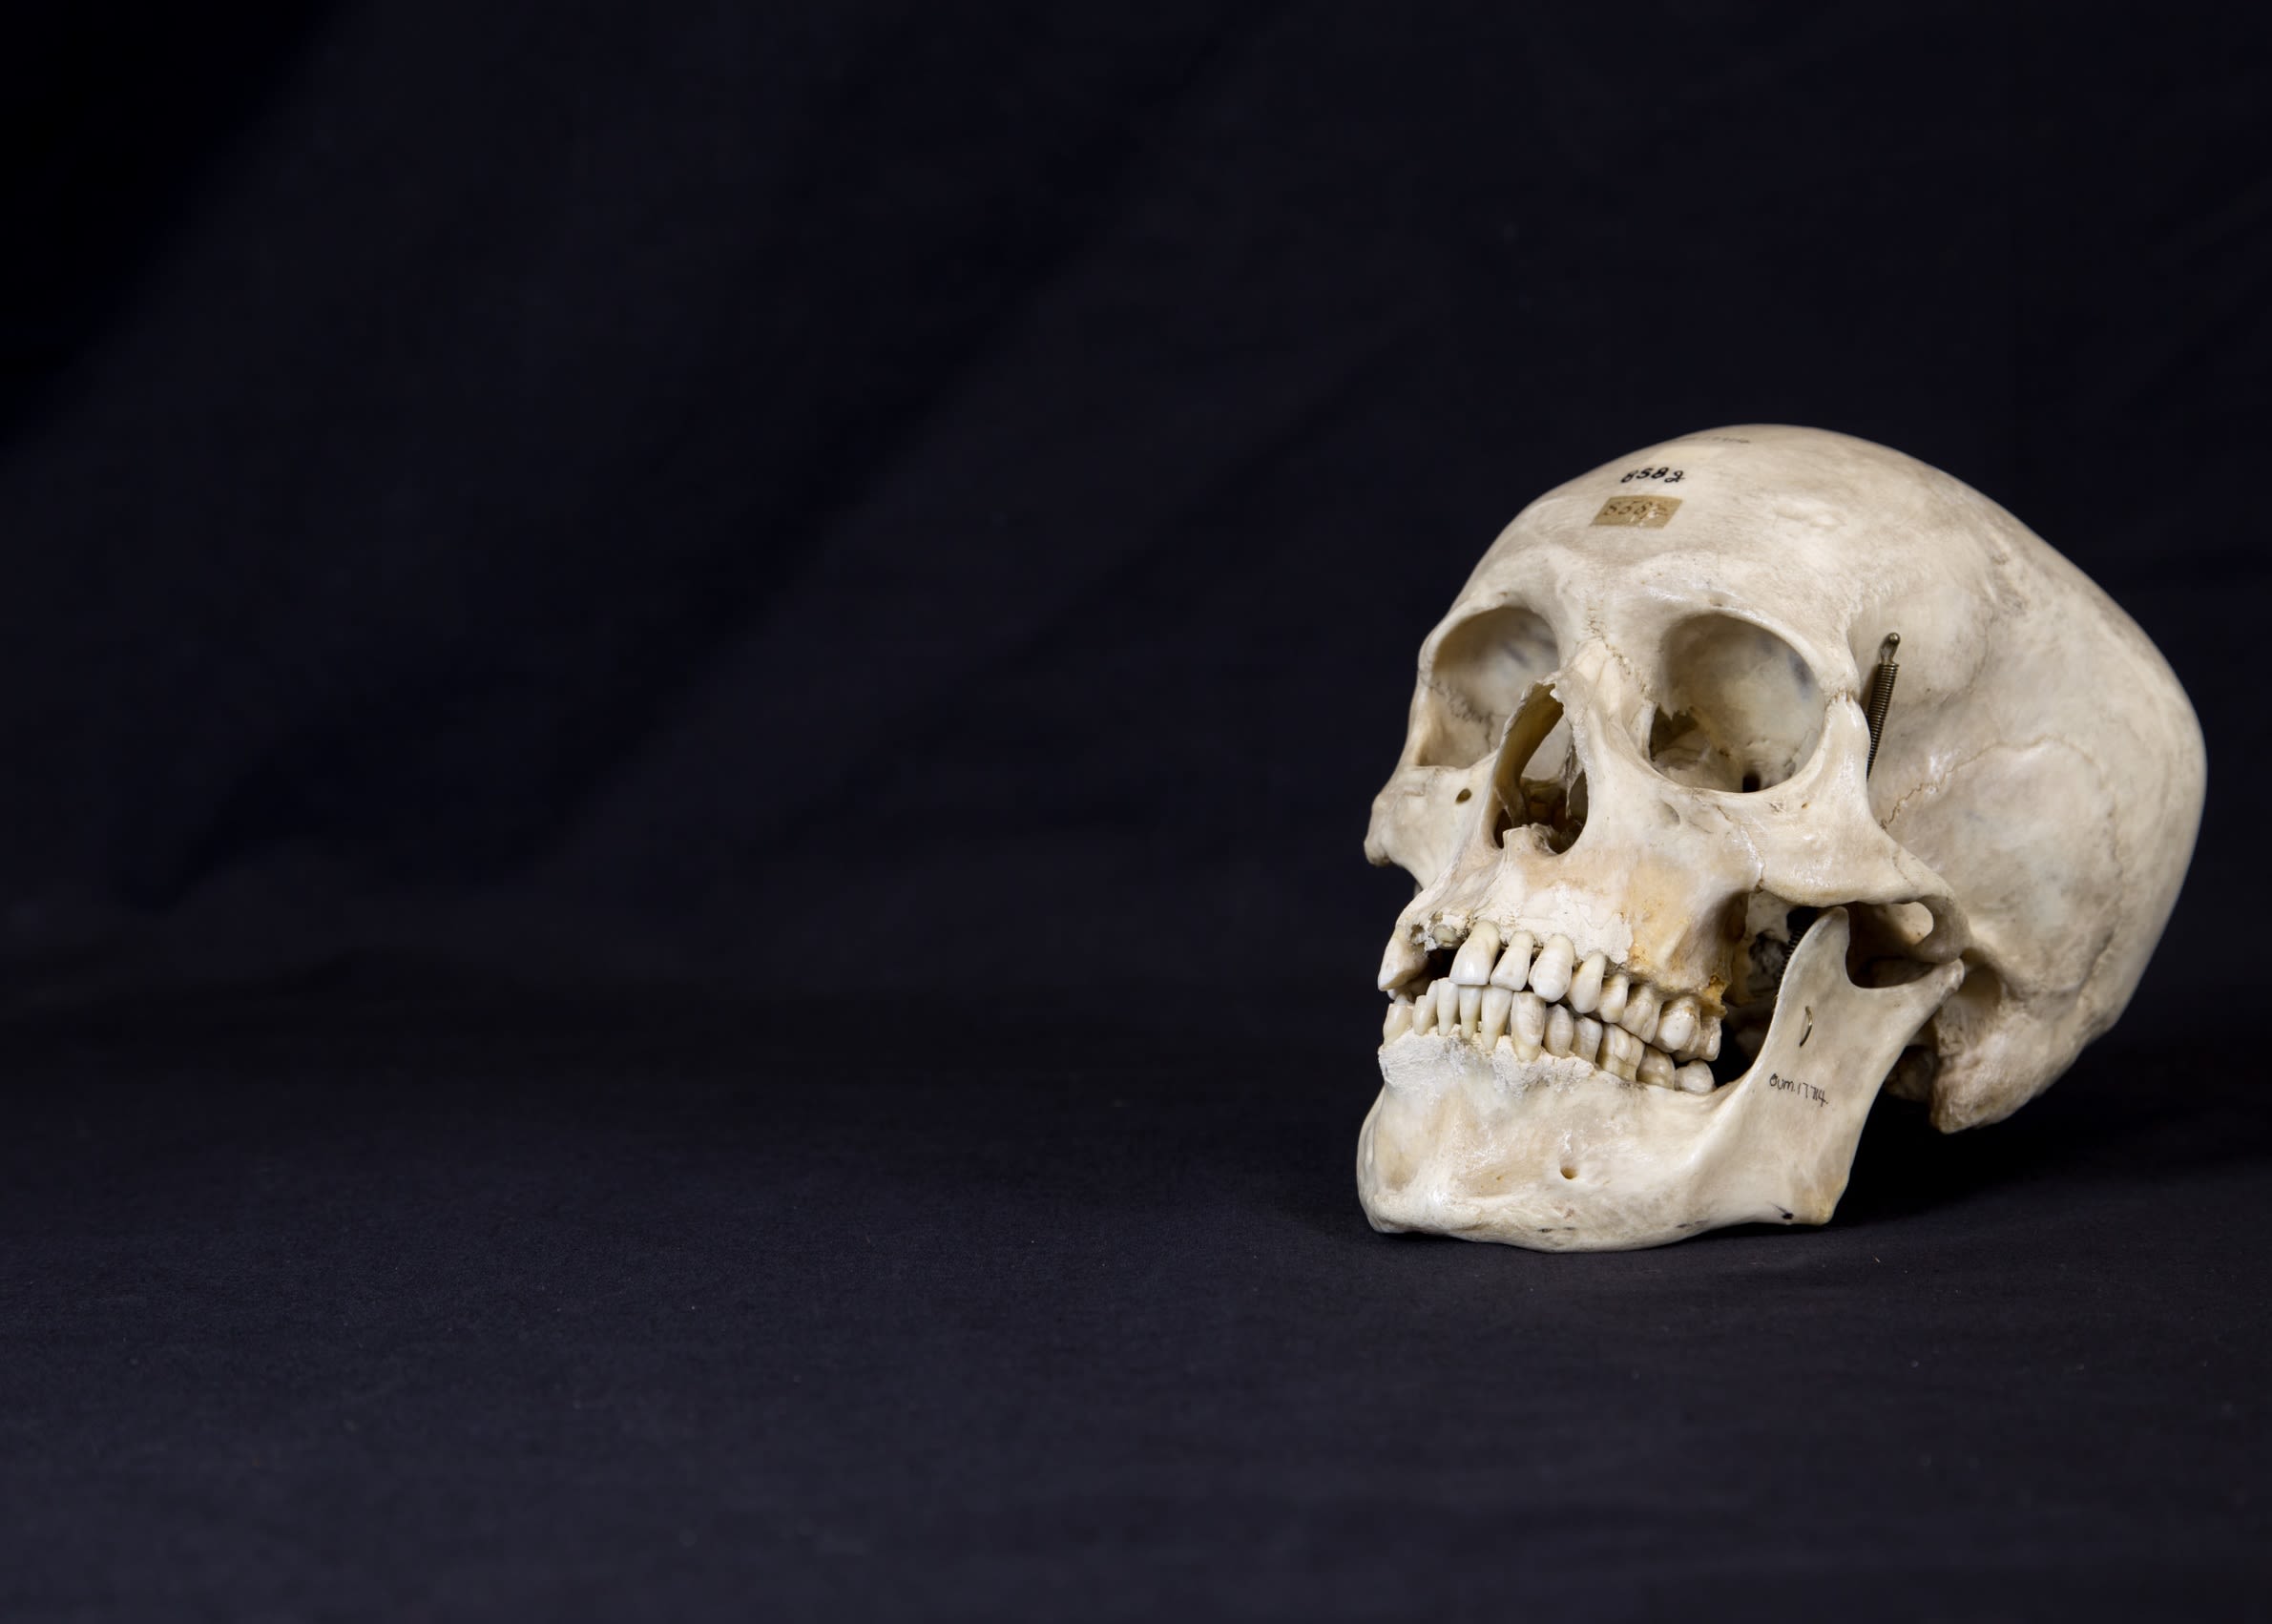
Humans have been on the move since our ancestors first evolved in Africa, meeting and mixing, staying and separating, as we try to survive in changing circumstances. Human relatives of the species Homo erectus began to spread across the world two million years ago. Modern people are all descended from members of our species, Homo sapiens (first skull image), some of whom came out of Africa much more recently – less than 100,000 years ago.
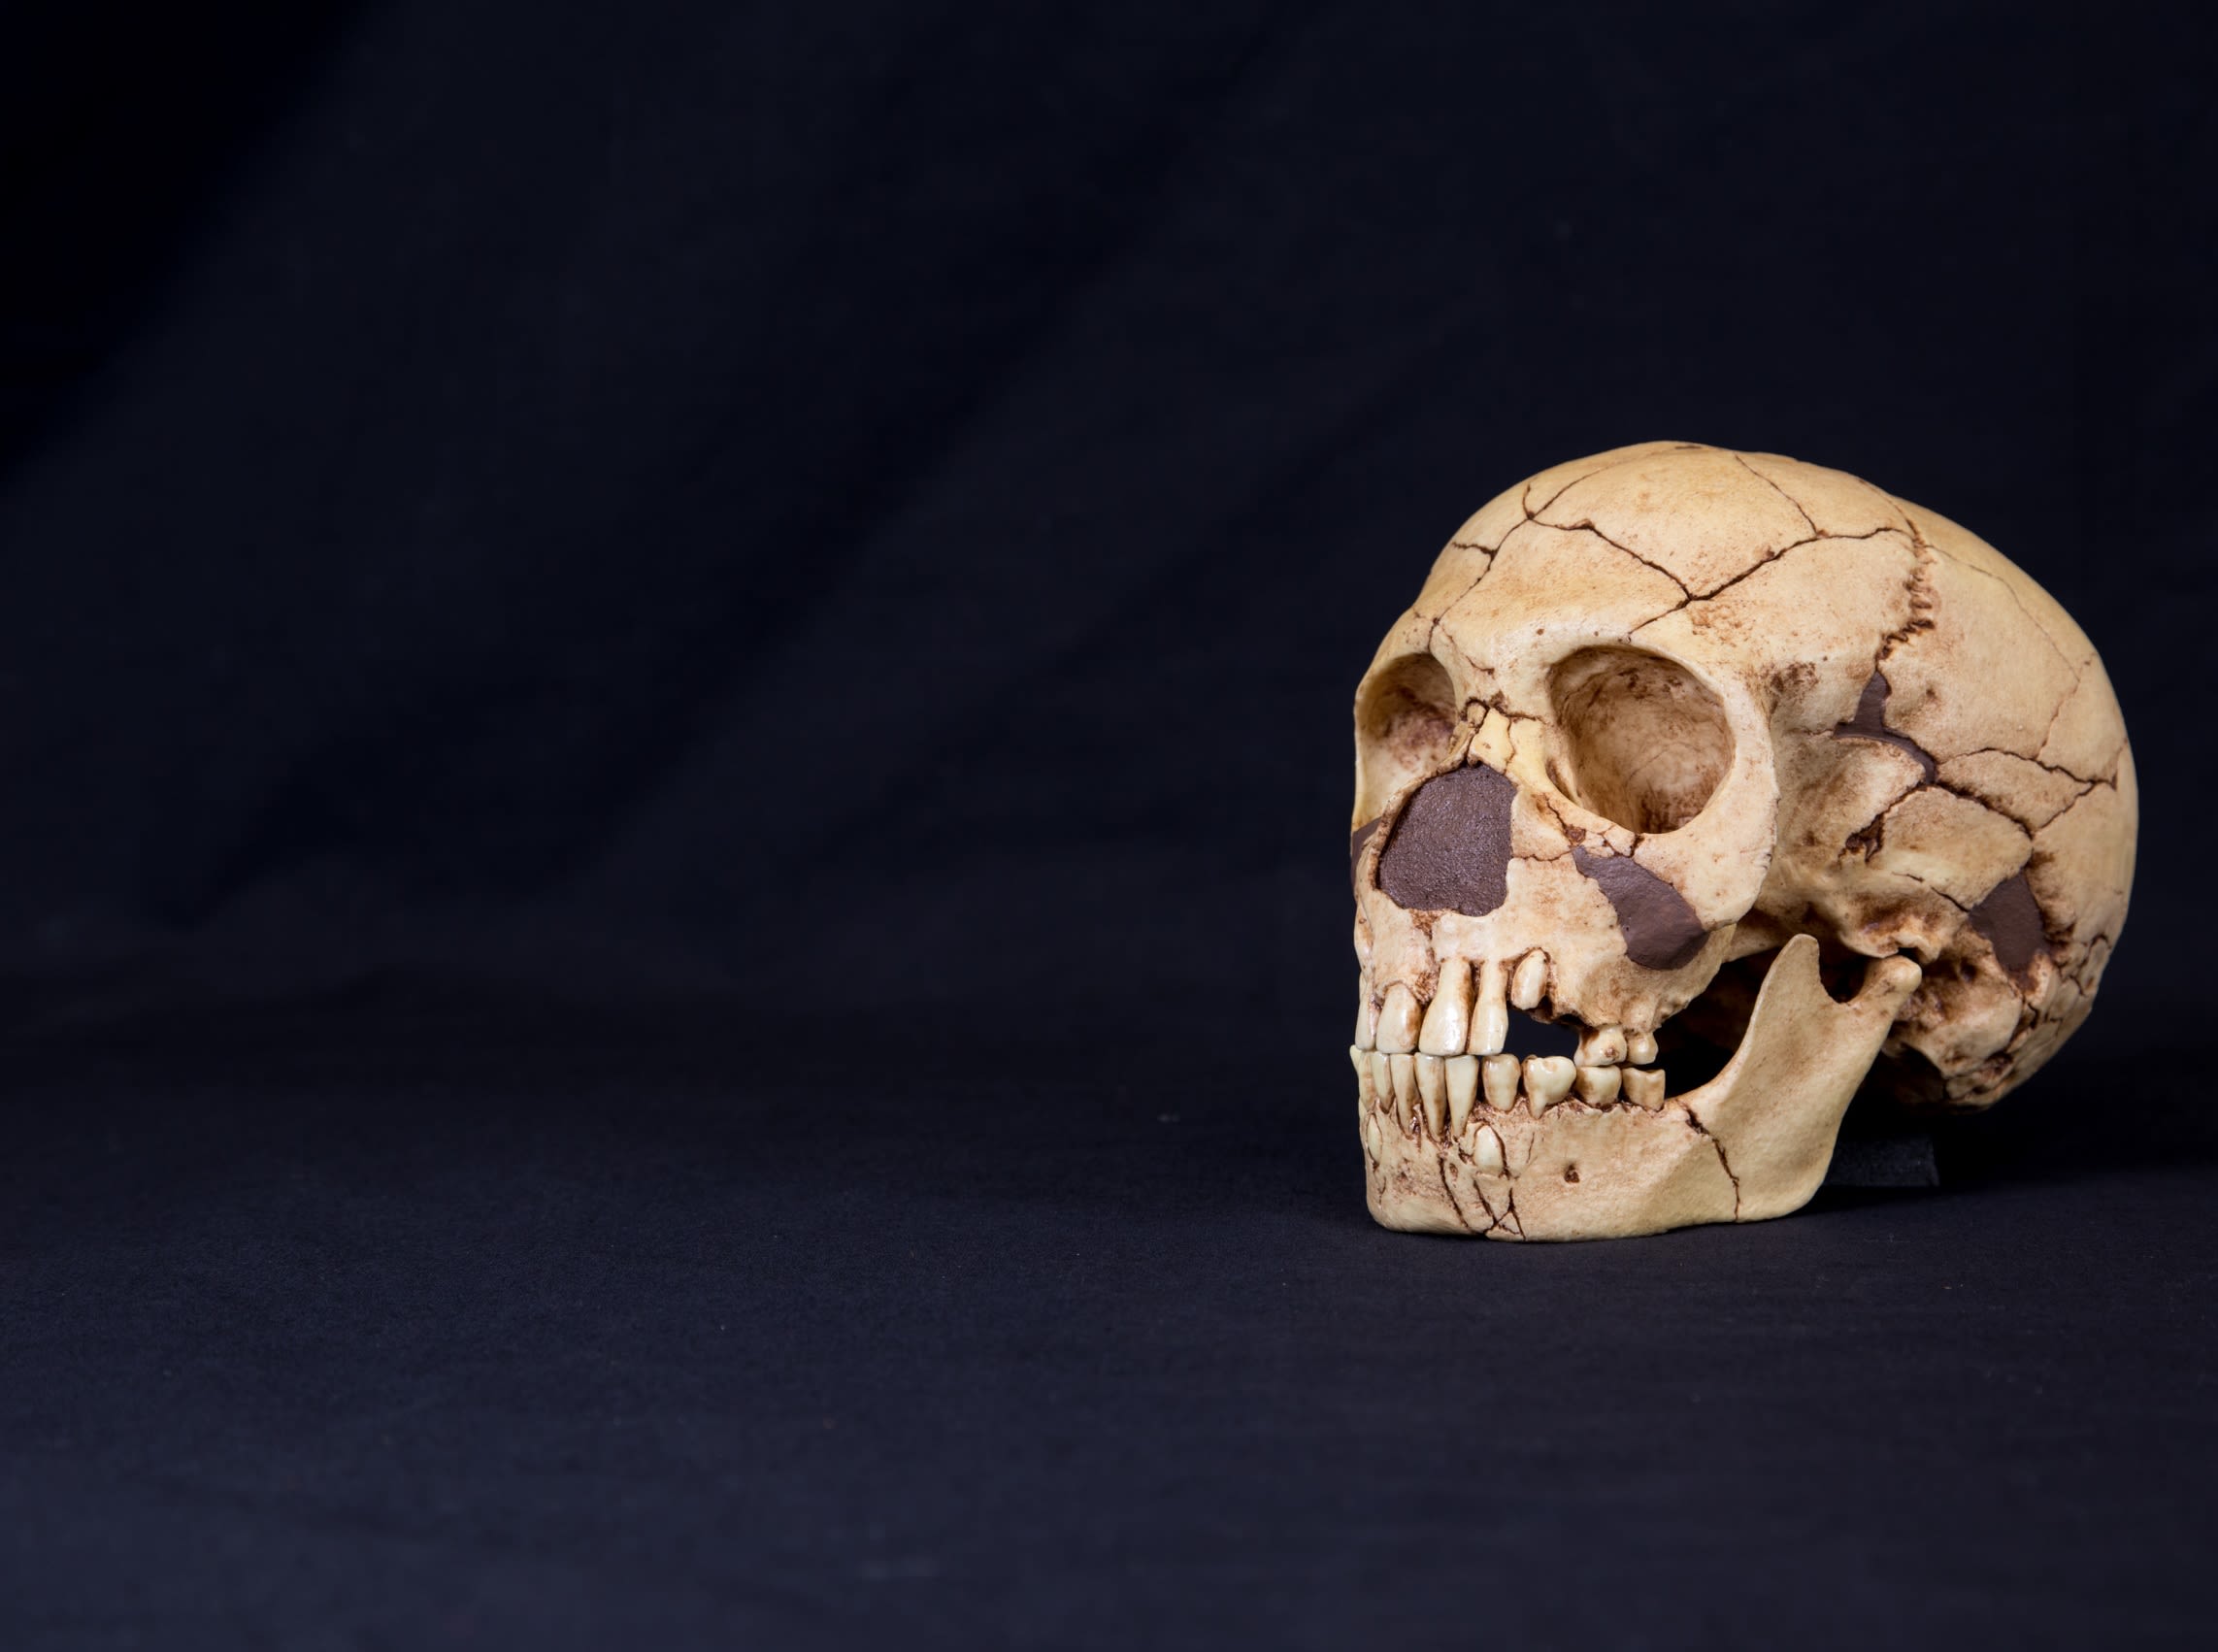
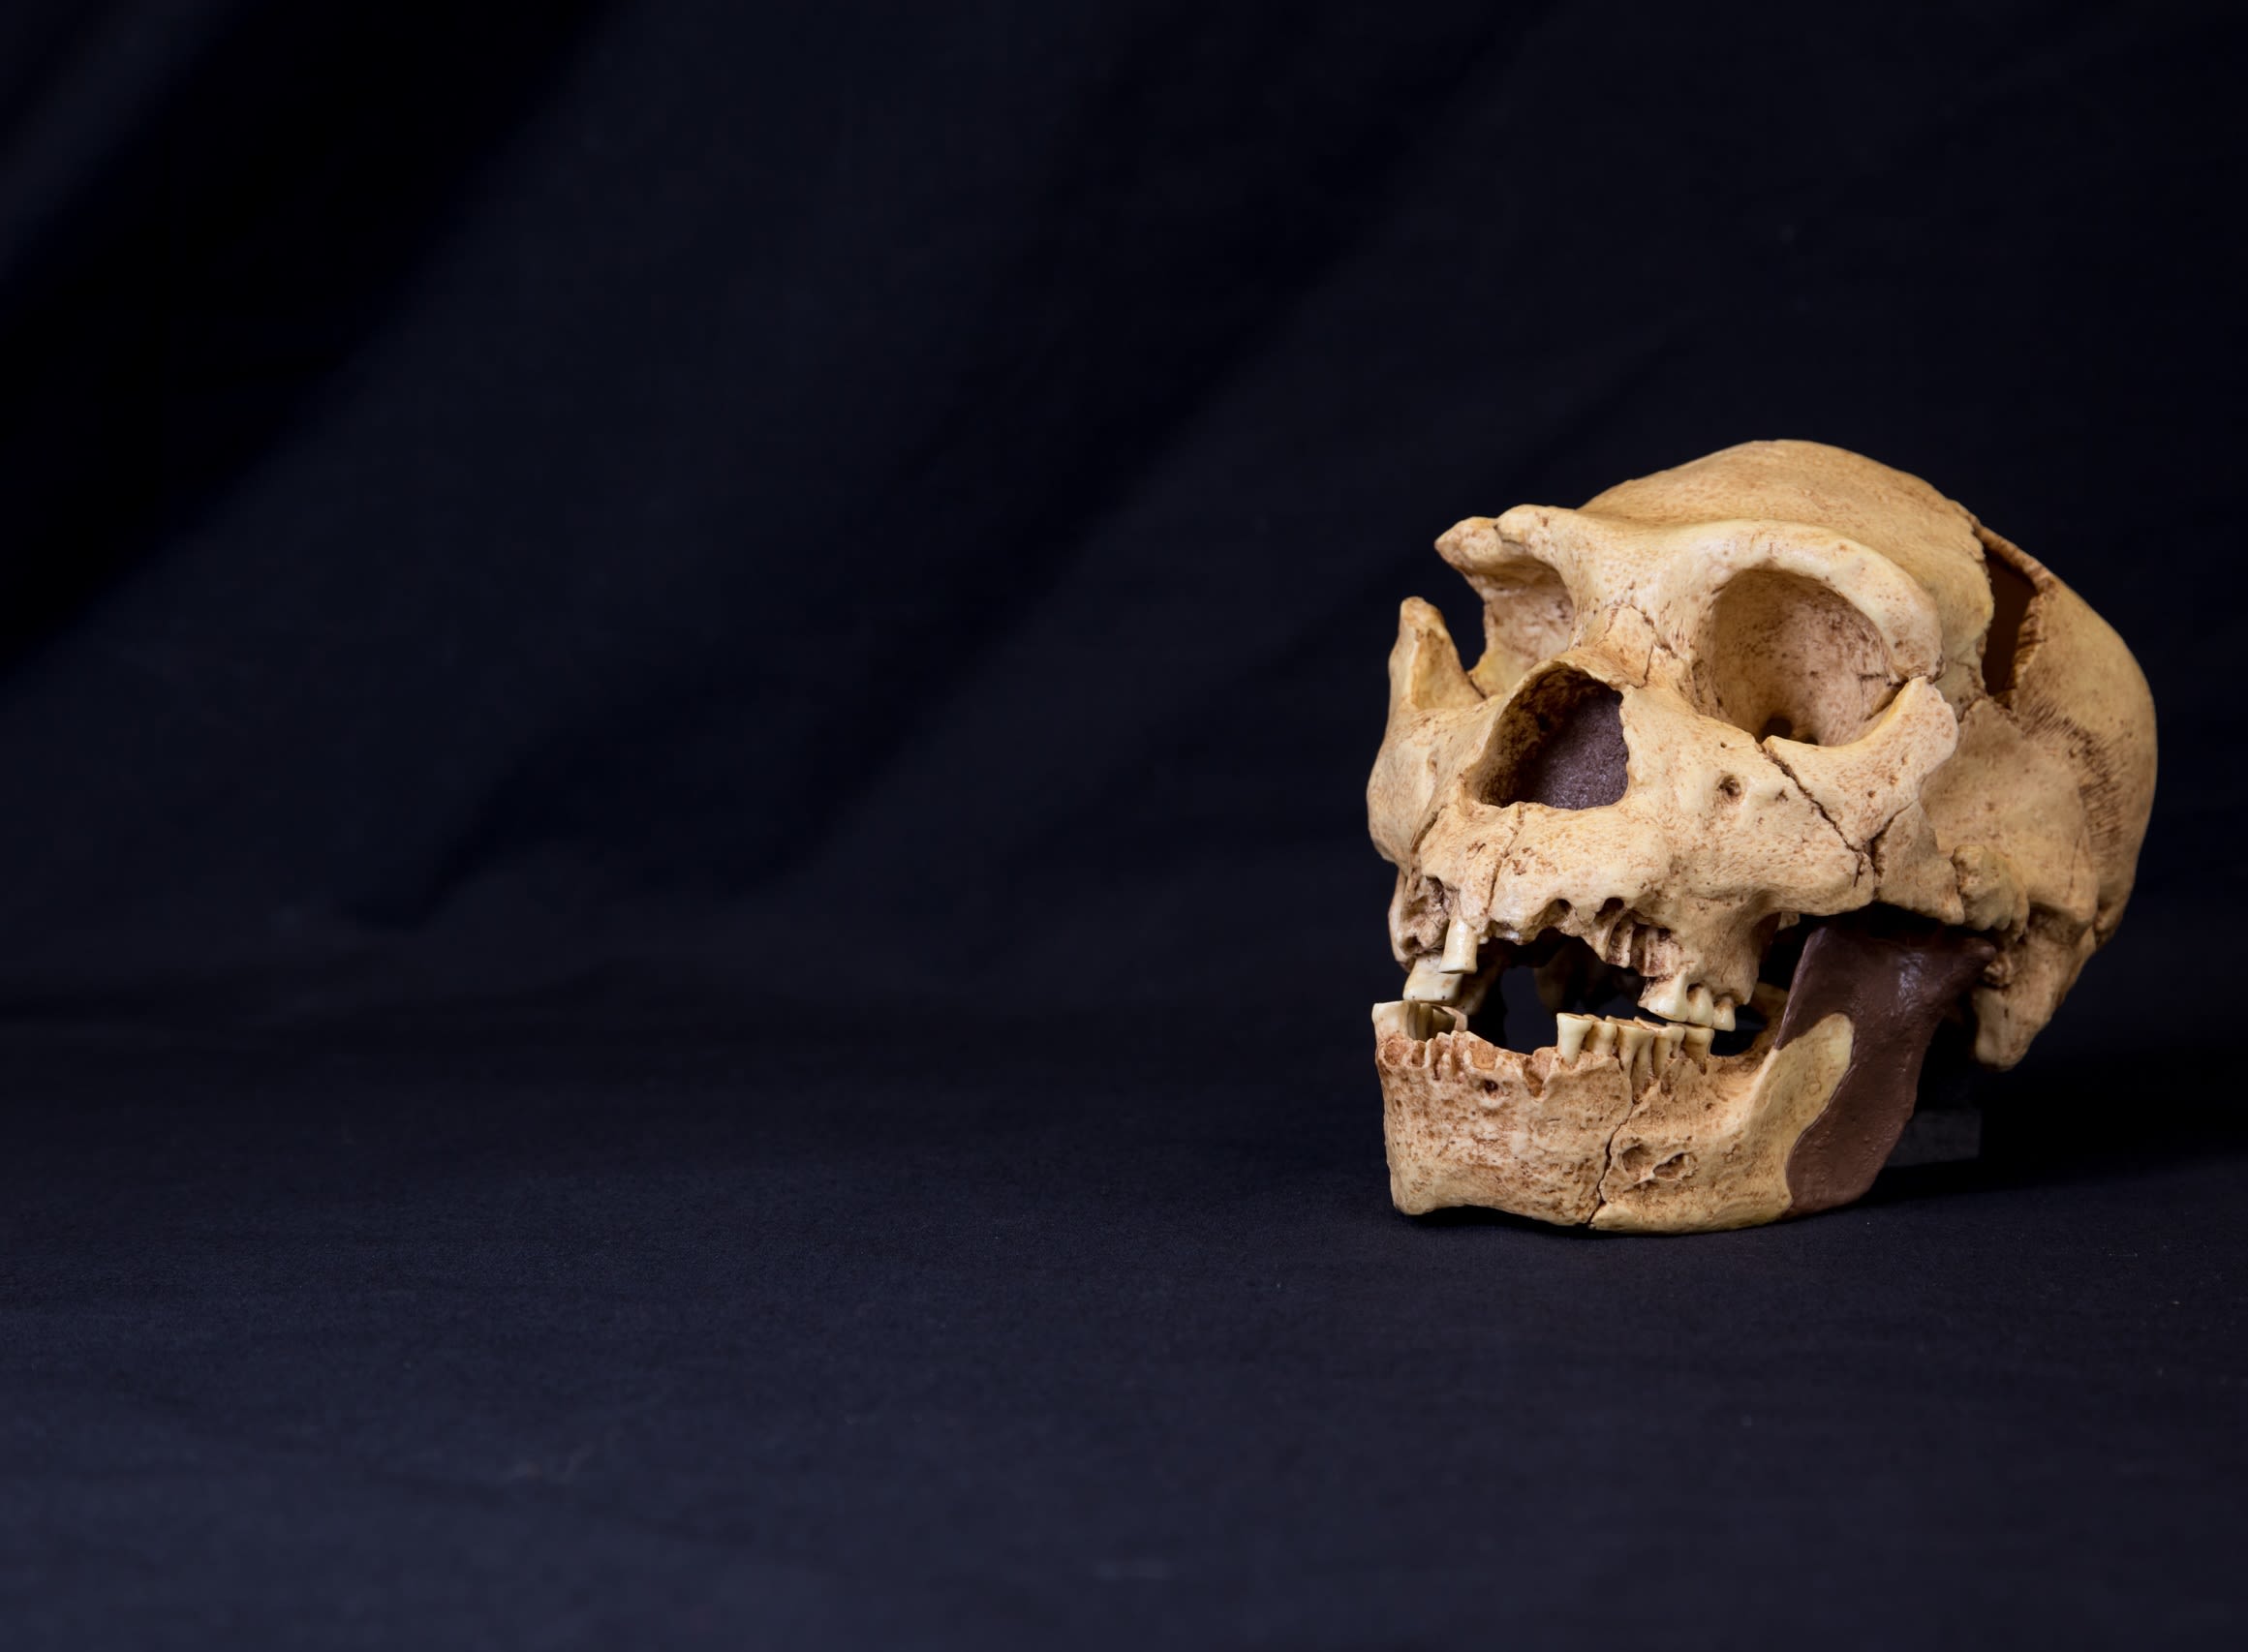
The period when human relatives first arrived in Britain – the period, geologically speaking, in which we still live – has swung between ice ages and relatively warm interludes such as we enjoy today. Species of Homo – such as Homo neanderthalensis (second skull image) and Homo heidelbergensis (third skull image) – were in Britain from 800,000 years ago, living by hunting wild animals and gathering plant foods as long as the climate was warm enough.

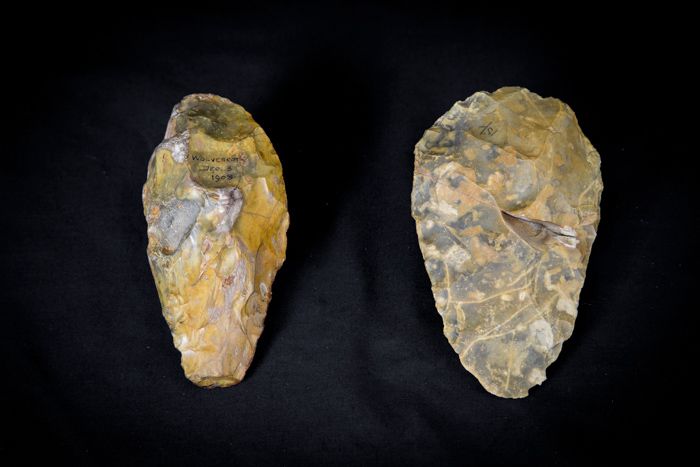
About 340,000 – 300,000 years ago, when conditions were slightly warmer than at present, Neanderthal hunters lived alongside a channel of the Thames near Oxford where the village of Wolvercote now stands. They made flint hand axes – all-purpose butchering, digging and chopping tools – and hunted animals now extinct in Britain.
About 340,000 – 300,000 years ago, when conditions were slightly warmer than at present, Neanderthal hunters lived alongside a channel of the Thames near Oxford where the village of Wolvercote now stands. They made flint hand axes – all-purpose butchering, digging and chopping tools – and hunted animals now extinct in Britain.
People of our own species, Homo sapiens, may have reached Britain around 44,000 years ago. Like their predecessors, they were hunter-gatherers who made and used stone tools. At the time, sea levels were lower, and Britain was connected to northern Europe by land.
The last ice age was still under way: at times the temperature fell so low that sheets of ice covered the country and made it uninhabitable, driving people and animals to seek warmer environments farther south. The ice reached its greatest extent around 26,000 years ago, and life for humans was impossible in Britain until it had retreated again around 11,600 years ago.
At that point the temperature rose very rapidly. Bands of hunters returned to Britain following the herds of reindeer and horses as they grazed the newly-growing grasslands, and later the deer, wild cattle and pigs that foraged in woodland. Others may have travelled up the Atlantic coast by sea. People have been living continuously in Britain ever since.

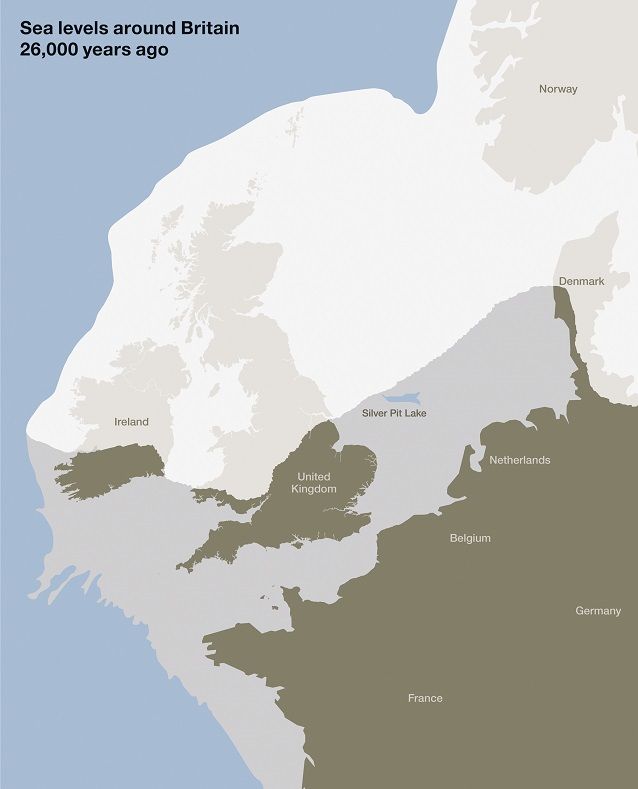
Sea levels around Britain 26,000 years ago. Blue: sea; white: ice; light grey: land; dark grey: present-day land.
Sea levels around Britain 26,000 years ago. Blue: sea; white: ice; light grey: land; dark grey: present-day land.
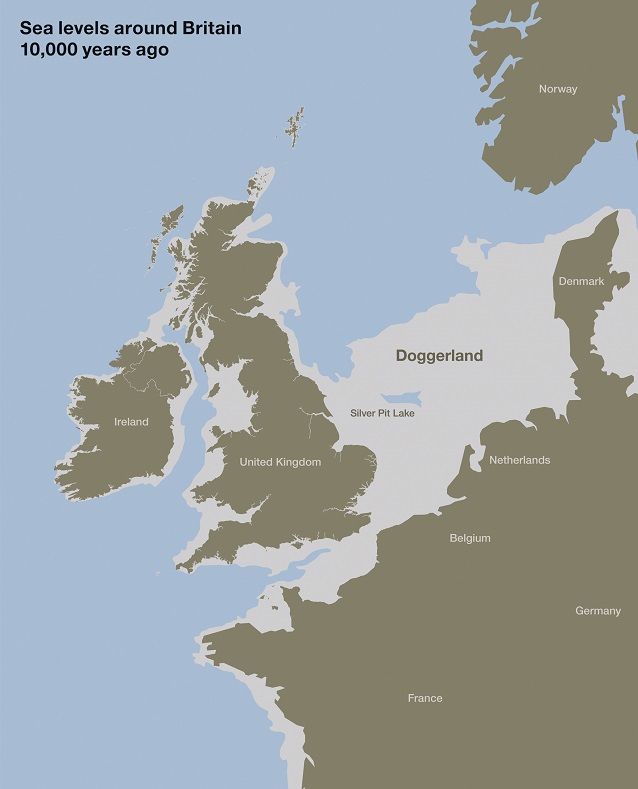
Sea levels around Britain 10,000 years ago. Blue: sea; light grey: land; dark grey: present-day land.
Sea levels around Britain 10,000 years ago. Blue: sea; light grey: land; dark grey: present-day land.

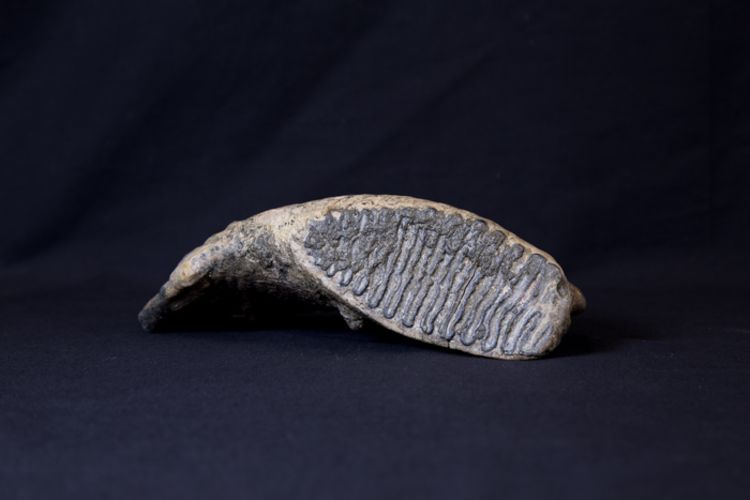
Molar of mammoth (Mammuthus primigenius) - Stanton Harcourt, Oxfordshire, England. Cold-tolerant mammals including mammoths, woolly rhinoceros, brown bear and hyena were present in Britain around 50,000 - 40,000 years ago, during the last glaciation, when temperatures were perhaps 10°C lower than at present.
Molar of mammoth (Mammuthus primigenius) - Stanton Harcourt, Oxfordshire, England. Cold-tolerant mammals including mammoths, woolly rhinoceros, brown bear and hyena were present in Britain around 50,000 - 40,000 years ago, during the last glaciation, when temperatures were perhaps 10°C lower than at present.
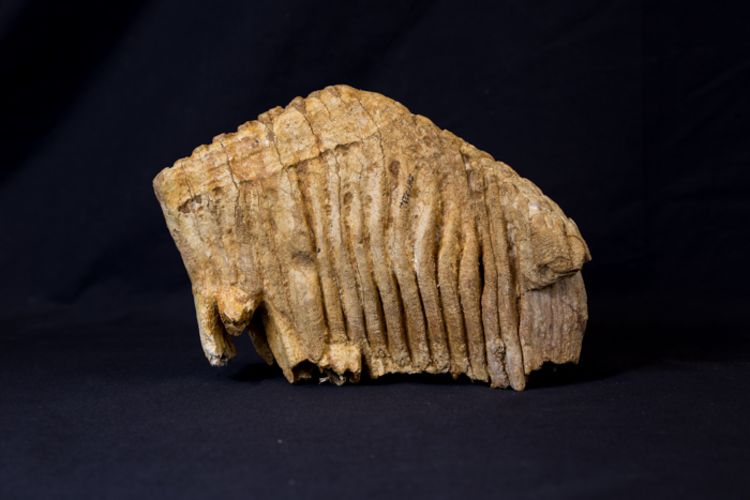
Molar of straight-tusked elephant (Palaeoloxodon antiquus), Wolvercote, Oxfordshire, England
Molar of straight-tusked elephant (Palaeoloxodon antiquus), Wolvercote, Oxfordshire, England


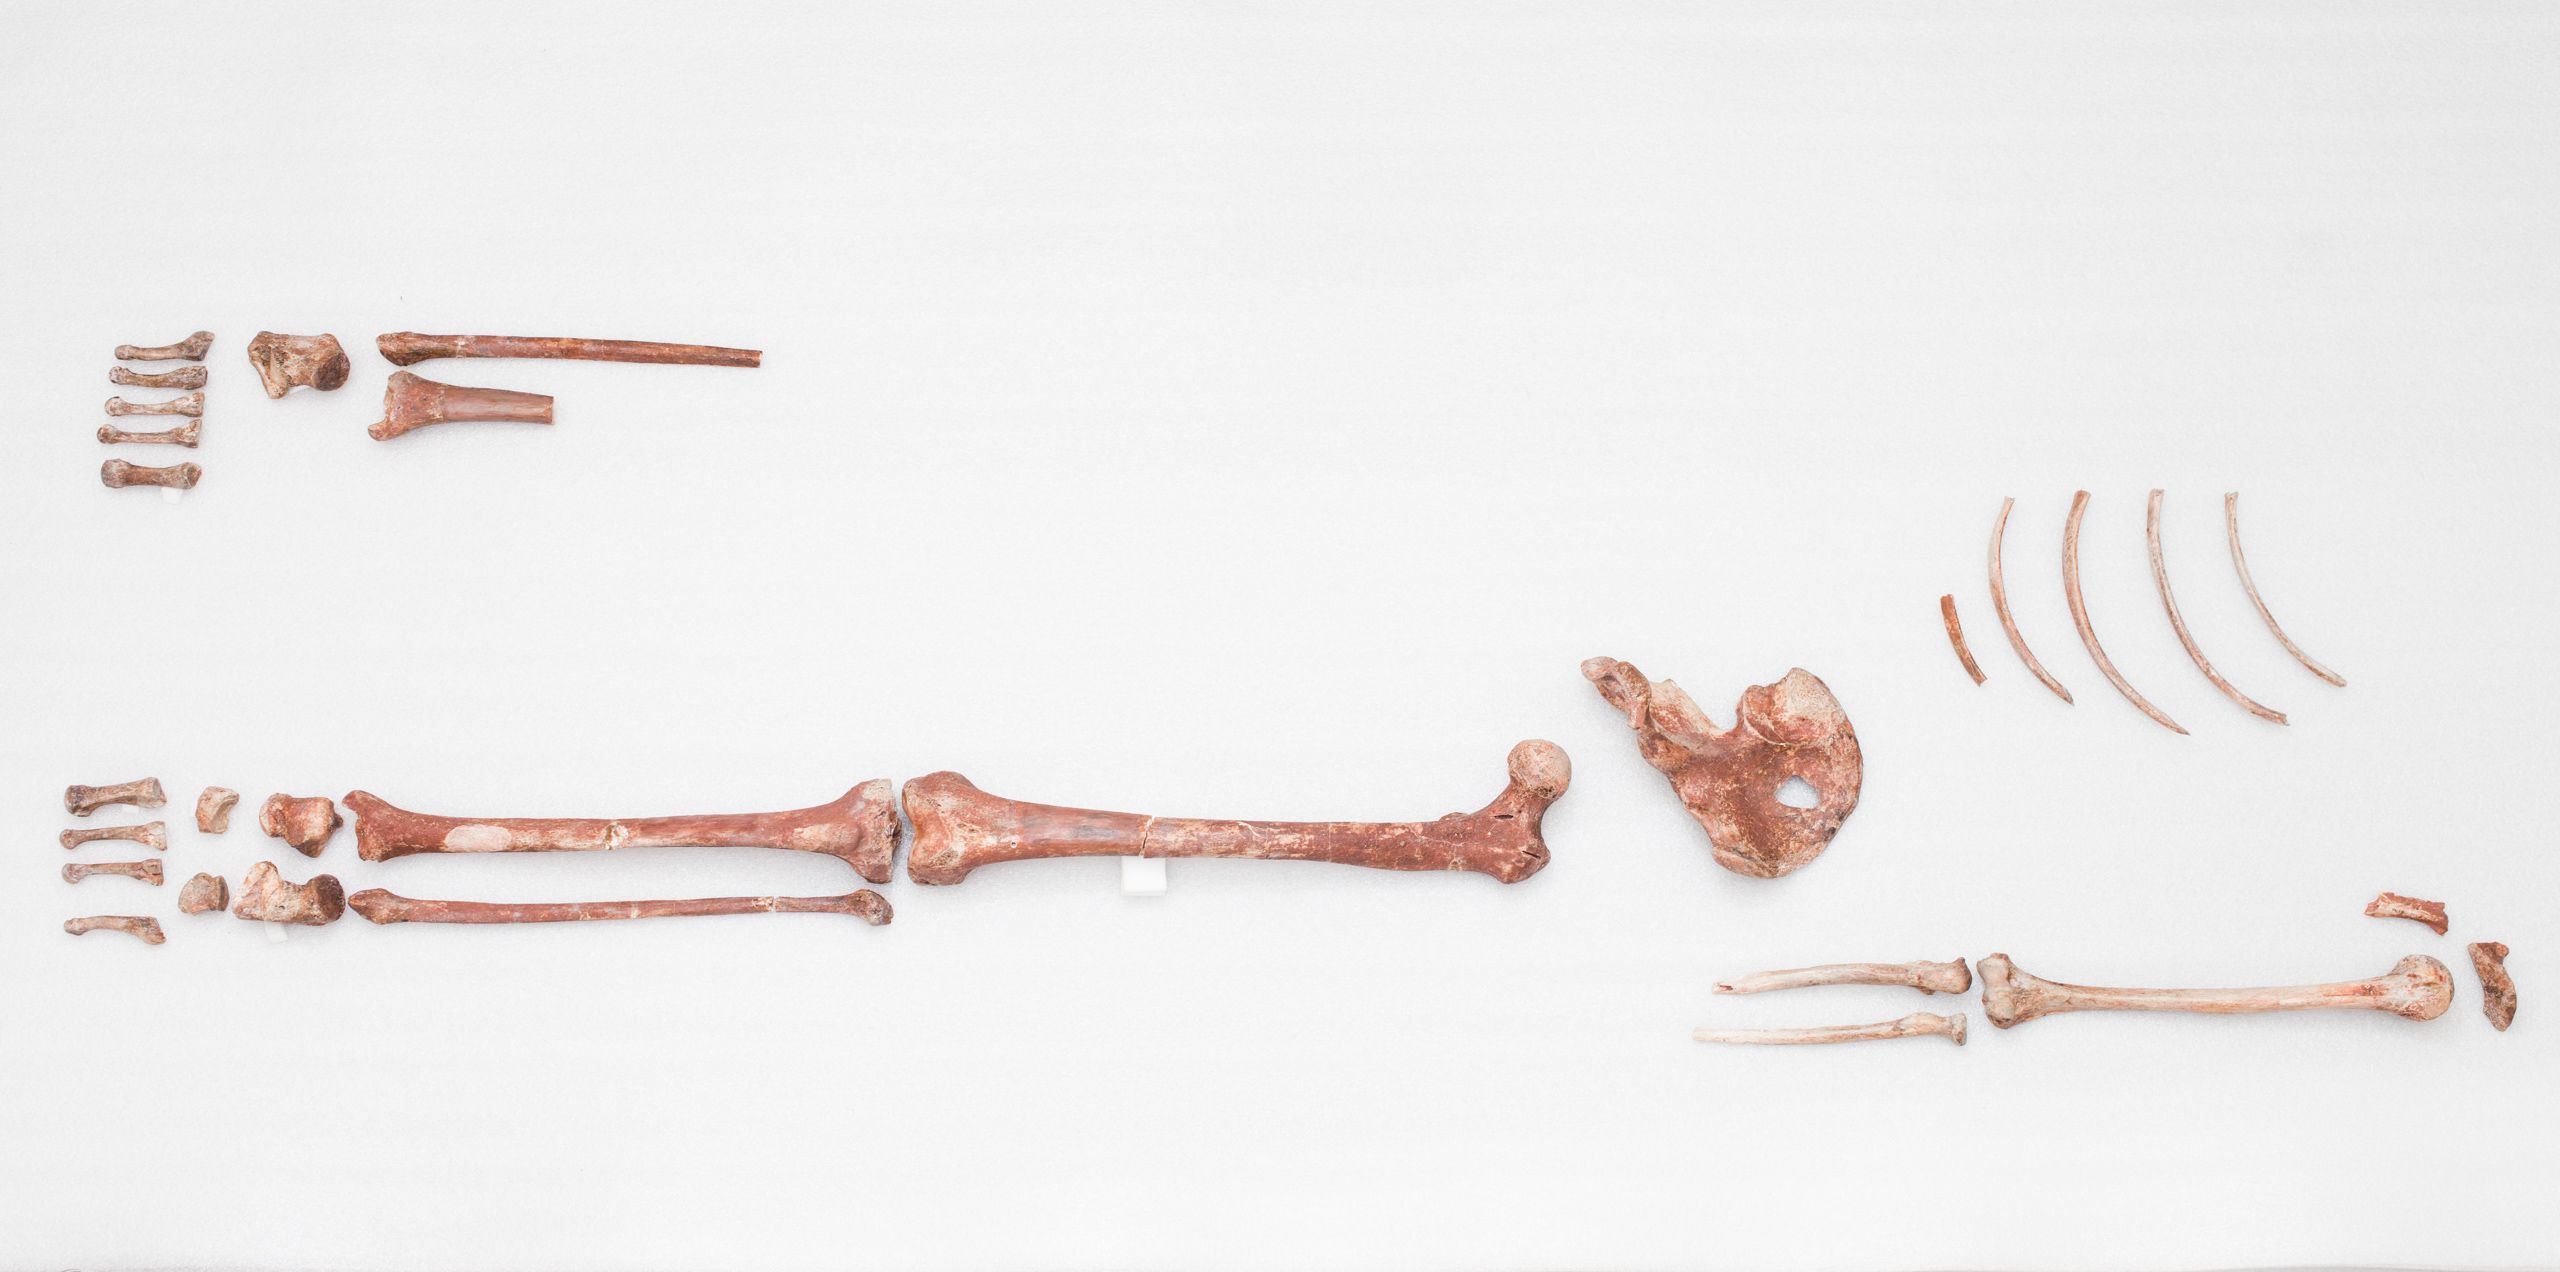
The ‘Red Lady’ of Paviland
Early in the 19th century, geologists digging in Goat's Hole Cave near Paviland on the Gower Peninsula in South Wales discovered a partial human skeleton. The body had been ceremonially buried, covered in red ochre and accompanied by decorations of pierced shell and ivory. A mammoth skull had been placed nearby, possibly to watch over the burial.
Because of the beads, the geologists believed that the skeleton was a woman, and assumed she came from the Roman period, around 2,000 years ago. We now know that the bones of the so-called ‘Red Lady’ are those of a young man, and far more ancient.


A young hunter?
How did this young man come to die in Wales so long ago? Stone tools and burned animal bones show that he could have been one of the hunters that used the cave over many thousands of years. How he died is a mystery; but his friends or family clearly thought it was important to bury him in style.
In 2008, scientists used improved radiocarbon dating techniques to give a date of around 33–34,000 years ago to the bones. This makes the ‘Red Lady’ one of the earliest examples of a ceremonial burial in Europe. Scientists are currently trying to extract DNA from a sample of the bone to find out more about who he was and where he came from.

The 'Red Lady' of Paviland
The 'Red Lady' of Paviland
Britain's genetic story
Our genes make us who we are, and they are made of DNA. Our human and non-human ancestors have passed this DNA down to us over millions of years. Groups of settlers who gradually populated Britain after the last Ice Age ended 11,600 years ago each contributed their own genetic signatures.
Modern genetic analysis can read the patterns of variation in our complete set of DNA – the human genome – that change subtly over time. Comparing these patterns in modern British people has provided new evidence about their geographical origins.


The DNA you inherit – and the DNA you don’t – is partly down to chance. Click above to play the Inheritance Lottery and see how in each generation some DNA is passed on, and some is lost. This interactive is not designed for mobile devices and is best viewed on desktop in latest version of Chrome or Firefox.
The DNA we share
The genetic code is written in a DNA alphabet with only four letters, A, C, G and T. There are three billion letters in the complete human genome. On average, one in 1,000 letters differs between any two unrelated individuals, which means that genetically speaking we are 99.9 per cent the same as every other human, yet we are all unique.
Every living thing is descended from the first life forms that evolved on Earth, so that although the genetic sequences of all the species alive today have diverged over millions of years, there are still many genetic similarities between humans and other species.
If our DNA is 99.9 per cent the same as everyone else's, how can we find differences?
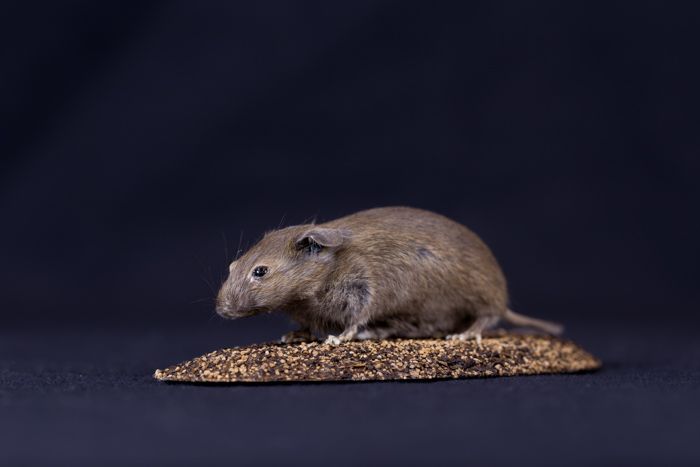
Humans share 85 per cent of their genes with the mouse.
Humans share 85 per cent of their genes with the mouse.

The DNA you inherit – and the DNA you don’t – is partly down to chance. Click above to play the Inheritance Lottery and see how in each generation some DNA is passed on, and some is lost. This interactive is not designed for mobile devices and is best viewed on desktop in latest version of Chrome or Firefox.
The DNA you inherit – and the DNA you don’t – is partly down to chance. Click above to play the Inheritance Lottery and see how in each generation some DNA is passed on, and some is lost. This interactive is not designed for mobile devices and is best viewed on desktop in latest version of Chrome or Firefox.
DNA: A Rich Tapestry: Whether it's the way we speak, or the team we support, the little differences between us can carry clues to our origins. See more at Oxford Sparks
DNA: A Rich Tapestry: Whether it's the way we speak, or the team we support, the little differences between us can carry clues to our origins. See more at Oxford Sparks
The People of the British Isles study
To learn more about the early history of Britain’s population, in 2004 researchers started to collect DNA from volunteers at rural locations throughout the UK. From these they selected around 2,000, all four of whose grandparents had been born in the same area.
These people are less likely than most of us to come from families that have been part of the great movements of people – from the country to cities, from north to south, or into and out of Britain – that have taken place since the middle of the 19th century.
While a minority of people in Britain today come from families long settled in the same place, those studied in the People of the British Isles project are likely to retain genetic signatures that reflect how the population of these islands developed historically. Many more people will also share elements of these patterns, but as their grandparents and parents moved and married others from different geographical locations, especially since the 19th century, the patterns will have become more jumbled up.

A genetic map of Britain
This map, created by the People of the British Isles study, is the result of comparing patterns in the DNA of a carefully selected sample of around 2,000 modern British people. It provides new evidence about links between genetic ancestry and geographical origins.
Like all of us, each of the People of the British Isles volunteers has a unique profile of variation in his or her DNA sequence. With the help of a powerful computer program, researchers compared all the profiles, and sorted them into clusters with others that were most similar. The 17 clusters that came out of the analysis are based on differences that are very small, but nonetheless clear.
To find the origins of these clusters, the researchers compared DNA from the British volunteers with DNA from modern populations across Europe. Each ‘British’ cluster turned out to be made up of different mixtures of European DNA, mostly corresponding with known movements of people over more than a thousand years.
How to read this map
- The map plots the geographical locations and genetic profiles of 2,039 people.
- People with similar patterns of genetic variation are grouped into clusters, and each is given a distinct coloured symbol.
- Each marker on the map represents one individual from the study sample.
- Individuals are plotted on the map according to the birthplaces of the grandparents, all four of whom had to be born in the same rural location. Each genetic cluster is named based on the main area it covers.
What the map is telling us
- People in the same genetic cluster are also very likely to live in the same region, centuries after their ancestors first settled there.
- The Central and Southern England genetic population – red squares – is dominant in England.
- Nine smaller genetic groups are identified in England and Wales.
- Western Scotland and Northern Ireland share genetic populations.
- Groups that we think of as ‘Celtic’ – Cornish, Welsh, Irish and Scottish – are genetically diverse.
Genetic Ancestry and the People of the British Isles


Genetic journeys and cultural connections
Between the end of the last Ice Age, around 11,600 years ago, and the Norman invasion in 1066, settlers arrived in Britain from various locations in Europe. The objects they left behind show that they brought with them cultural changes such as agriculture, metalworking and new languages. The genetic data from the People of the British Isles study, combined with the archaeological evidence, gives a more complete story of how society changed.
In some cases there is a clear genetic signature associated with cultural change. For example, the genetic data suggests a large movement of people from Northern France into England and Scotland between 6,000 and 3,000 years ago, at about the same time that agriculture began to be widespread. In contrast, the Norman invaders, who greatly changed the language and government of Britain, have left little genetic legacy.
The first permanent settlements
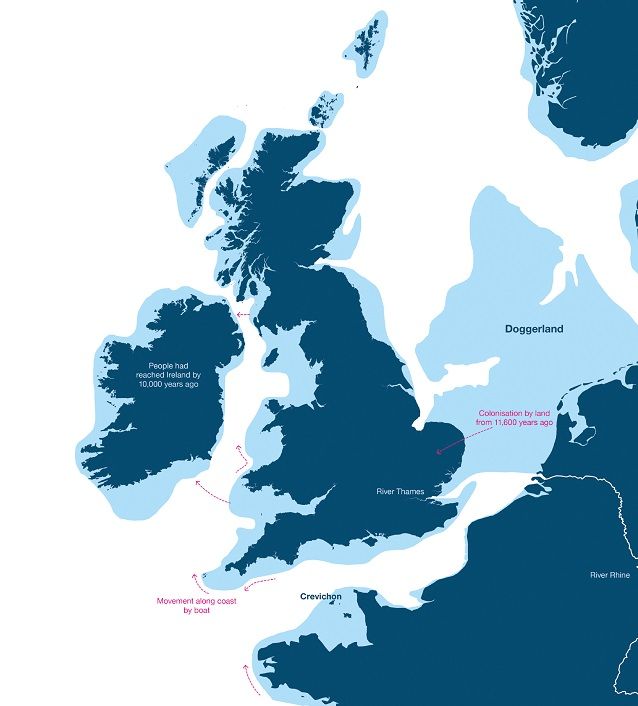
When the ice finally retreated, Britain was still part of the European mainland. It was easy for people to arrive on foot, although some also travelled around the coast. Traces of their genetic signatures survive all over the country, but particularly in Wales.
Around 11,600 years ago the temperature began to rise very rapidly and the ice that had covered most of Britain began to retreat to the Arctic. The first settlers entered Britain across Doggerland, the lowlands of what is now the North Sea, probably following animals such as reindeer, or travelled in boats along the Atlantic coast to the western parts of Britain. As the climate continued to warm, sea levels rose, and from around 8,500 years ago Britain became an island.
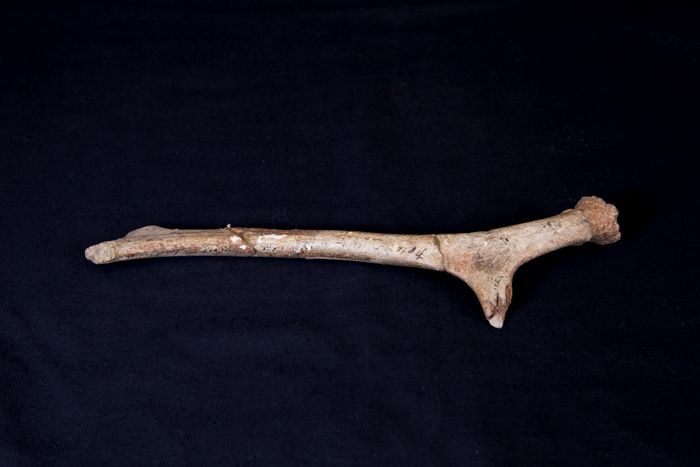
Reindeer antler (Rangifer tarandus) – British, late Glacial
Reindeer antler (Rangifer tarandus) – British, late Glacial
The genetic evidence suggests that people from Wales are most closely related to the Palaeolithic (Old Stone Age) settlers who first moved across from west Germany and the Atlantic coast of Europe as the ice retreated. Those first settlers spread all over the British Isles, but the descendants of those in England, Scotland and Ireland were more likely to encounter and mix with groups of later arrivals, and so gradually acquired different patterns of genetic variation from those in Wales.
Agriculture, trade and technology
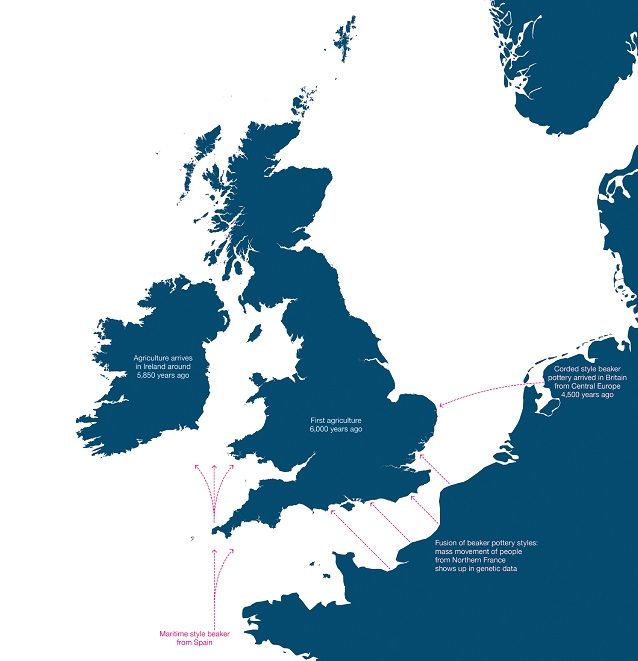
By 6,000 years ago Britain had become a collection of islands, and new cultures transmitted through Europe made their way across the Channel. People continued to move and settle: DNA from northern France turns up in the genetic record throughout England and Scotland, but not Wales.
Throughout the Neolithic (New Stone Age) and Bronze Ages, from around 6,000 to 3,000 years ago, people continued to pass back and forth across the English Channel, importing their distinctive styles of pottery and metalwork.
The genetic study revealed a pattern of DNA dated to around this time that is shared by people now living in northern France and those in England, Northern Ireland and Scotland, but none of those in Wales. It looks as though substantial numbers of people took the opportunity to cross the narrow Channel, and spread through most of the country.
These people may have included the first farmers at the start of the Neolithic Age. Or they may have been some of the ‘Beaker people’, who introduced characteristic decorated pottery, developed copper working and traded metal with other parts of Europe.

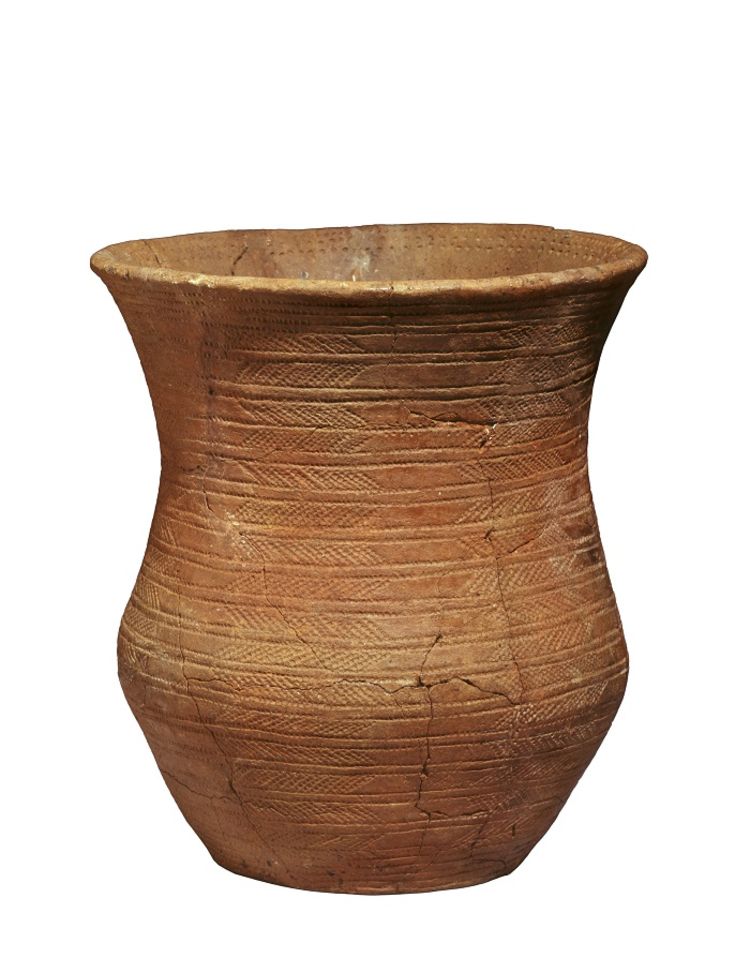
Beaker pottery vessel, 2500 – 2150 BC, Oxfordshire. Towards the end of the Neolithic, around 4,500 years ago, people using distinctive beaker-shaped pottery vessels spread across Europe and into Britain. Their skill in copper working led to the Bronze Age, which lasted until about 2,800 years ago. Image: The Ashmolean Museum, University of Oxford
Beaker pottery vessel, 2500 – 2150 BC, Oxfordshire. Towards the end of the Neolithic, around 4,500 years ago, people using distinctive beaker-shaped pottery vessels spread across Europe and into Britain. Their skill in copper working led to the Bronze Age, which lasted until about 2,800 years ago. Image: The Ashmolean Museum, University of Oxford
Subjects of empire
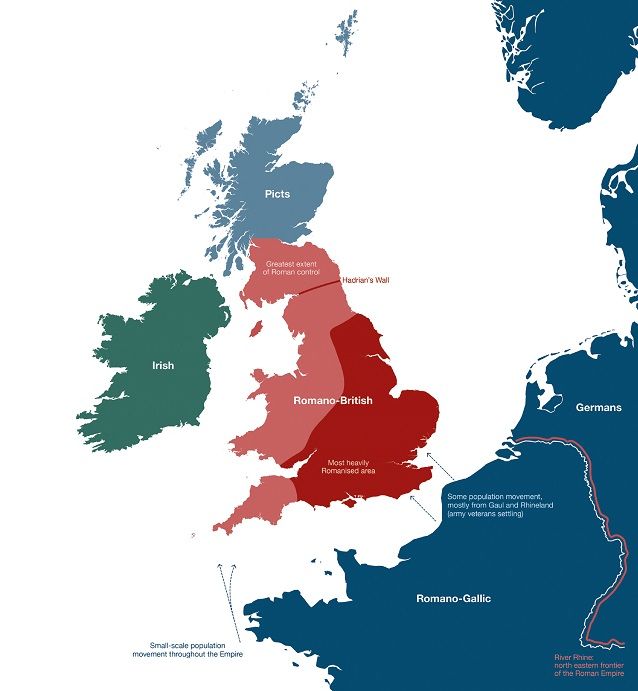
Roman armies and administrators controlled Britain from the year 43 until the empire collapsed in the 5th century.
From the year 43, Roman influence transformed the way of life of people in southern and eastern Britain. The rulers organised agriculture and economic activity, some based on slave labour, around villas in the countryside. They expanded towns and built roads to speed the progress of their legions between military forts. Yet in the more remote areas of western and northern Britain, life continued much as before.
The legions were recruited from all across the Roman Empire. However, there is very little evidence today of a genetic legacy from other Roman dominions. Only small numbers settled: as the Empire collapsed, Rome withdrew the legionaries and high-ranking officials.

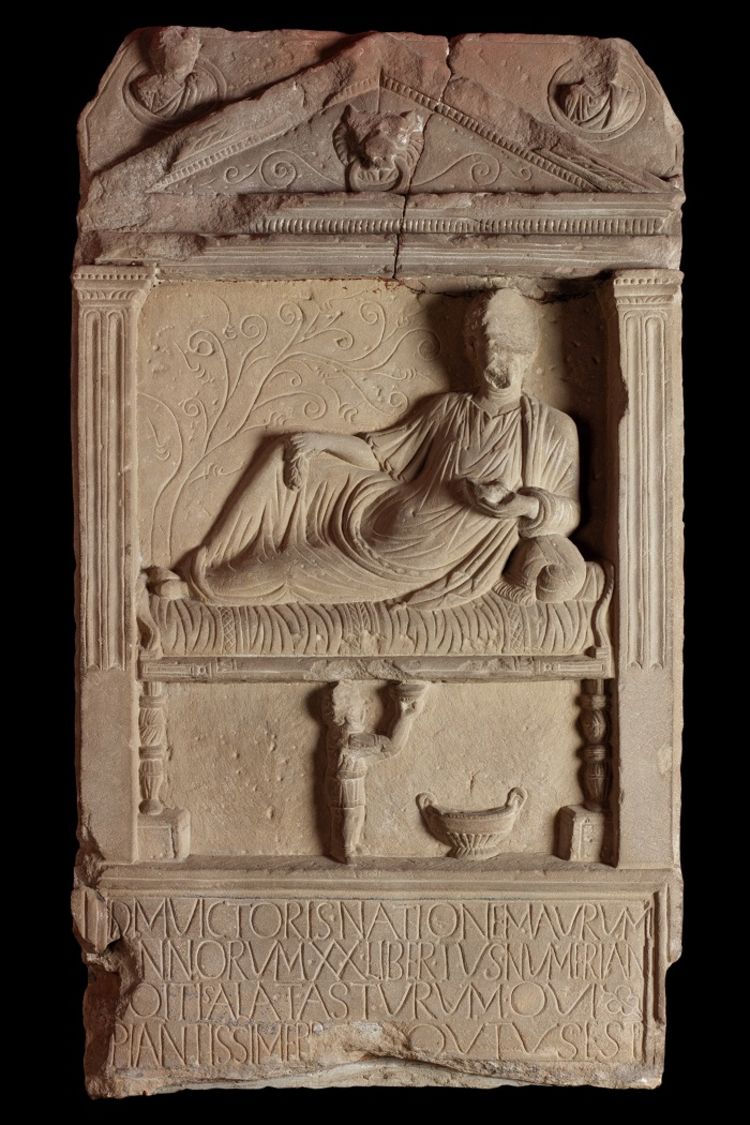
Tombstone of a Roman soldier from North Africa, found in South Shields, Tyne and Wear, in the 1880s. The inscription reads: ‘To the spirits of the departed (and) of Victor, from the Moorish nation, aged 20, freedman of Numerianus, trooper of the First Cavalry Regiment of Astruians, who most devotedly conducted him to the tomb.’ Image: © Tyne & Wear Archives & Museums / Bridgeman Images
Tombstone of a Roman soldier from North Africa, found in South Shields, Tyne and Wear, in the 1880s. The inscription reads: ‘To the spirits of the departed (and) of Victor, from the Moorish nation, aged 20, freedman of Numerianus, trooper of the First Cavalry Regiment of Astruians, who most devotedly conducted him to the tomb.’ Image: © Tyne & Wear Archives & Museums / Bridgeman Images

When the ice finally retreated, Britain was still part of the European mainland. It was easy for people to arrive on foot, although some also travelled around the coast. Traces of their genetic signatures survive all over the country, but particularly in Wales.
When the ice finally retreated, Britain was still part of the European mainland. It was easy for people to arrive on foot, although some also travelled around the coast. Traces of their genetic signatures survive all over the country, but particularly in Wales.

By 6,000 years ago Britain had become a collection of islands, and new cultures transmitted through Europe made their way across the Channel. People continued to move and settle: DNA from northern France turns up in the genetic record throughout England and Scotland, but not Wales.
By 6,000 years ago Britain had become a collection of islands, and new cultures transmitted through Europe made their way across the Channel. People continued to move and settle: DNA from northern France turns up in the genetic record throughout England and Scotland, but not Wales.

Roman armies and administrators controlled Britain from the year 43 until the empire collapsed in the 5th century.
Roman armies and administrators controlled Britain from the year 43 until the empire collapsed in the 5th century.
Tribes and kingdoms
The population of Britain fell from a few million to fewer than one million people after the Romans left in the 5th century. Over the next few centuries, groups of Angles and Saxons arrived from northwest Germany and southern Denmark, taking advantage of this ‘failed state’ and establishing Anglo-Saxon as the dominant culture in England.
The genetic map of Britain shows that most of the eastern, central and southern parts of England form a single genetic group with between 10 and 40 per cent Anglo-Saxon ancestry. However, people in this cluster also retain DNA from earlier settlers. The invaders did not wipe out the existing population; instead, they seem to have integrated with them.
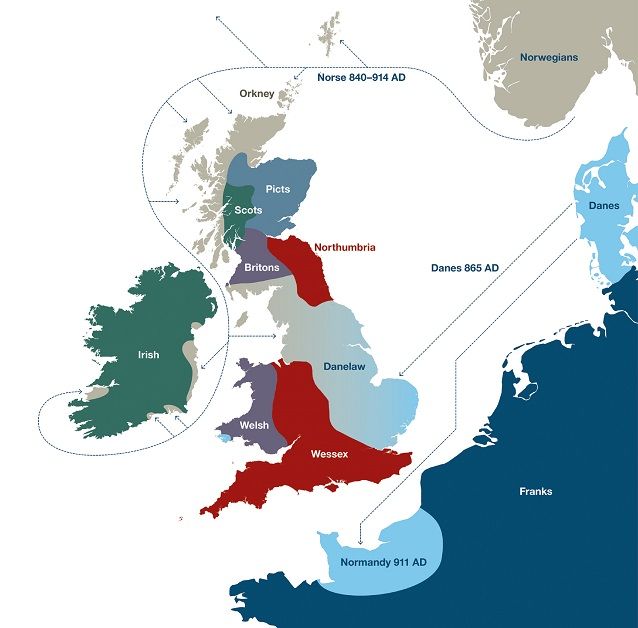
The number of Norse place names in the Danelaw, the region that fell under the control of the Danes and Norwegians in the 9th century, shows the extent of the Vikings’ cultural influence. But only in Orkney is there a substantial legacy of Viking DNA.
From the 8th century, Vikings from Norway and Denmark mounted raids all around the coasts of Britain and fought the Anglo-Saxons for control of the English kingdoms. While Norwegian DNA is still detectable in northern groups, especially in Orkney, no genetic cluster in England corresponds to the areas that were under Danish control for two centuries. The Danes were highly influential militarily, politically and culturally but may have settled in numbers that were too modest to have a clear genetic impact on the population.
In 1066 William Duke of Normandy defeated the last Anglo-Saxon King, Harold, at the Battle of Hastings. Norman rule transformed the English language and culture, but there is no genetic evidence to suggest that more than a small number of elite families settled in Britain.
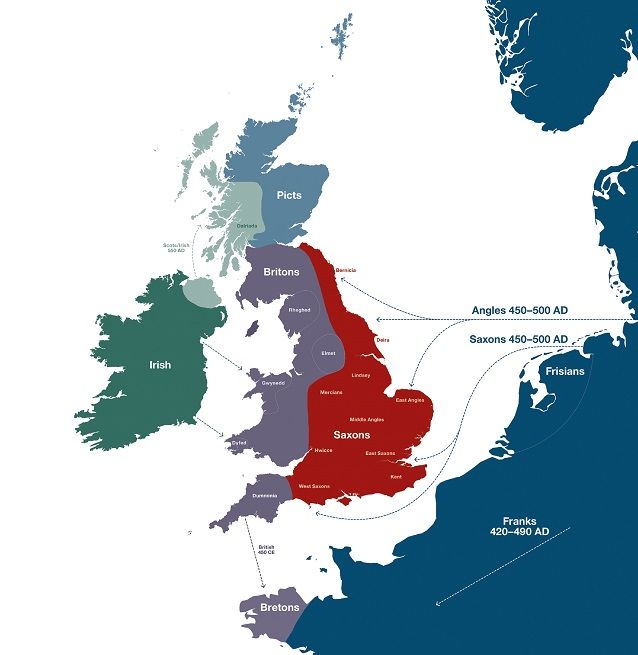
The map of Britain’s tribes and kingdoms at the start of the 7th century corresponds remarkably closely with the map of genetic clusters in the People of the British Isles map. The south and east of England, which experienced the greatest early Anglo-Saxon settlement, forms a single large cluster (red squares) with a component of its DNA from northwest Germany.

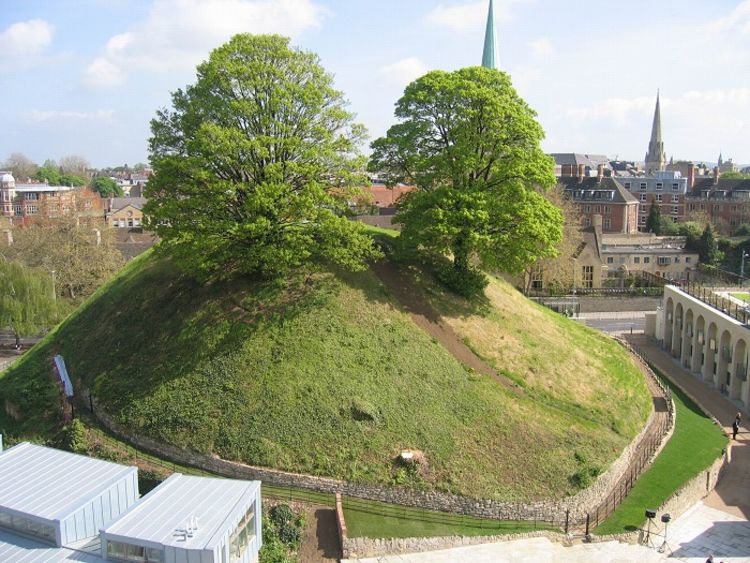
Oxford Castle mound, Norman motte constructed by Robert D'Oyley in 1071 – 73. Image: Oxford Castle Unlocked
Oxford Castle mound, Norman motte constructed by Robert D'Oyley in 1071 – 73. Image: Oxford Castle Unlocked

The number of Norse place names in the Danelaw, the region that fell under the control of the Danes and Norwegians in the 9th century, shows the extent of the Vikings’ cultural influence. But only in Orkney is there a substantial legacy of Viking DNA.
The number of Norse place names in the Danelaw, the region that fell under the control of the Danes and Norwegians in the 9th century, shows the extent of the Vikings’ cultural influence. But only in Orkney is there a substantial legacy of Viking DNA.

The map of Britain’s tribes and kingdoms at the start of the 7th century corresponds remarkably closely with the map of genetic clusters in the People of the British Isles map. The south and east of England, which experienced the greatest early Anglo-Saxon settlement, forms a single large cluster (red squares) with a component of its DNA from northwest Germany.
The map of Britain’s tribes and kingdoms at the start of the 7th century corresponds remarkably closely with the map of genetic clusters in the People of the British Isles map. The south and east of England, which experienced the greatest early Anglo-Saxon settlement, forms a single large cluster (red squares) with a component of its DNA from northwest Germany.
The making of modern Britain
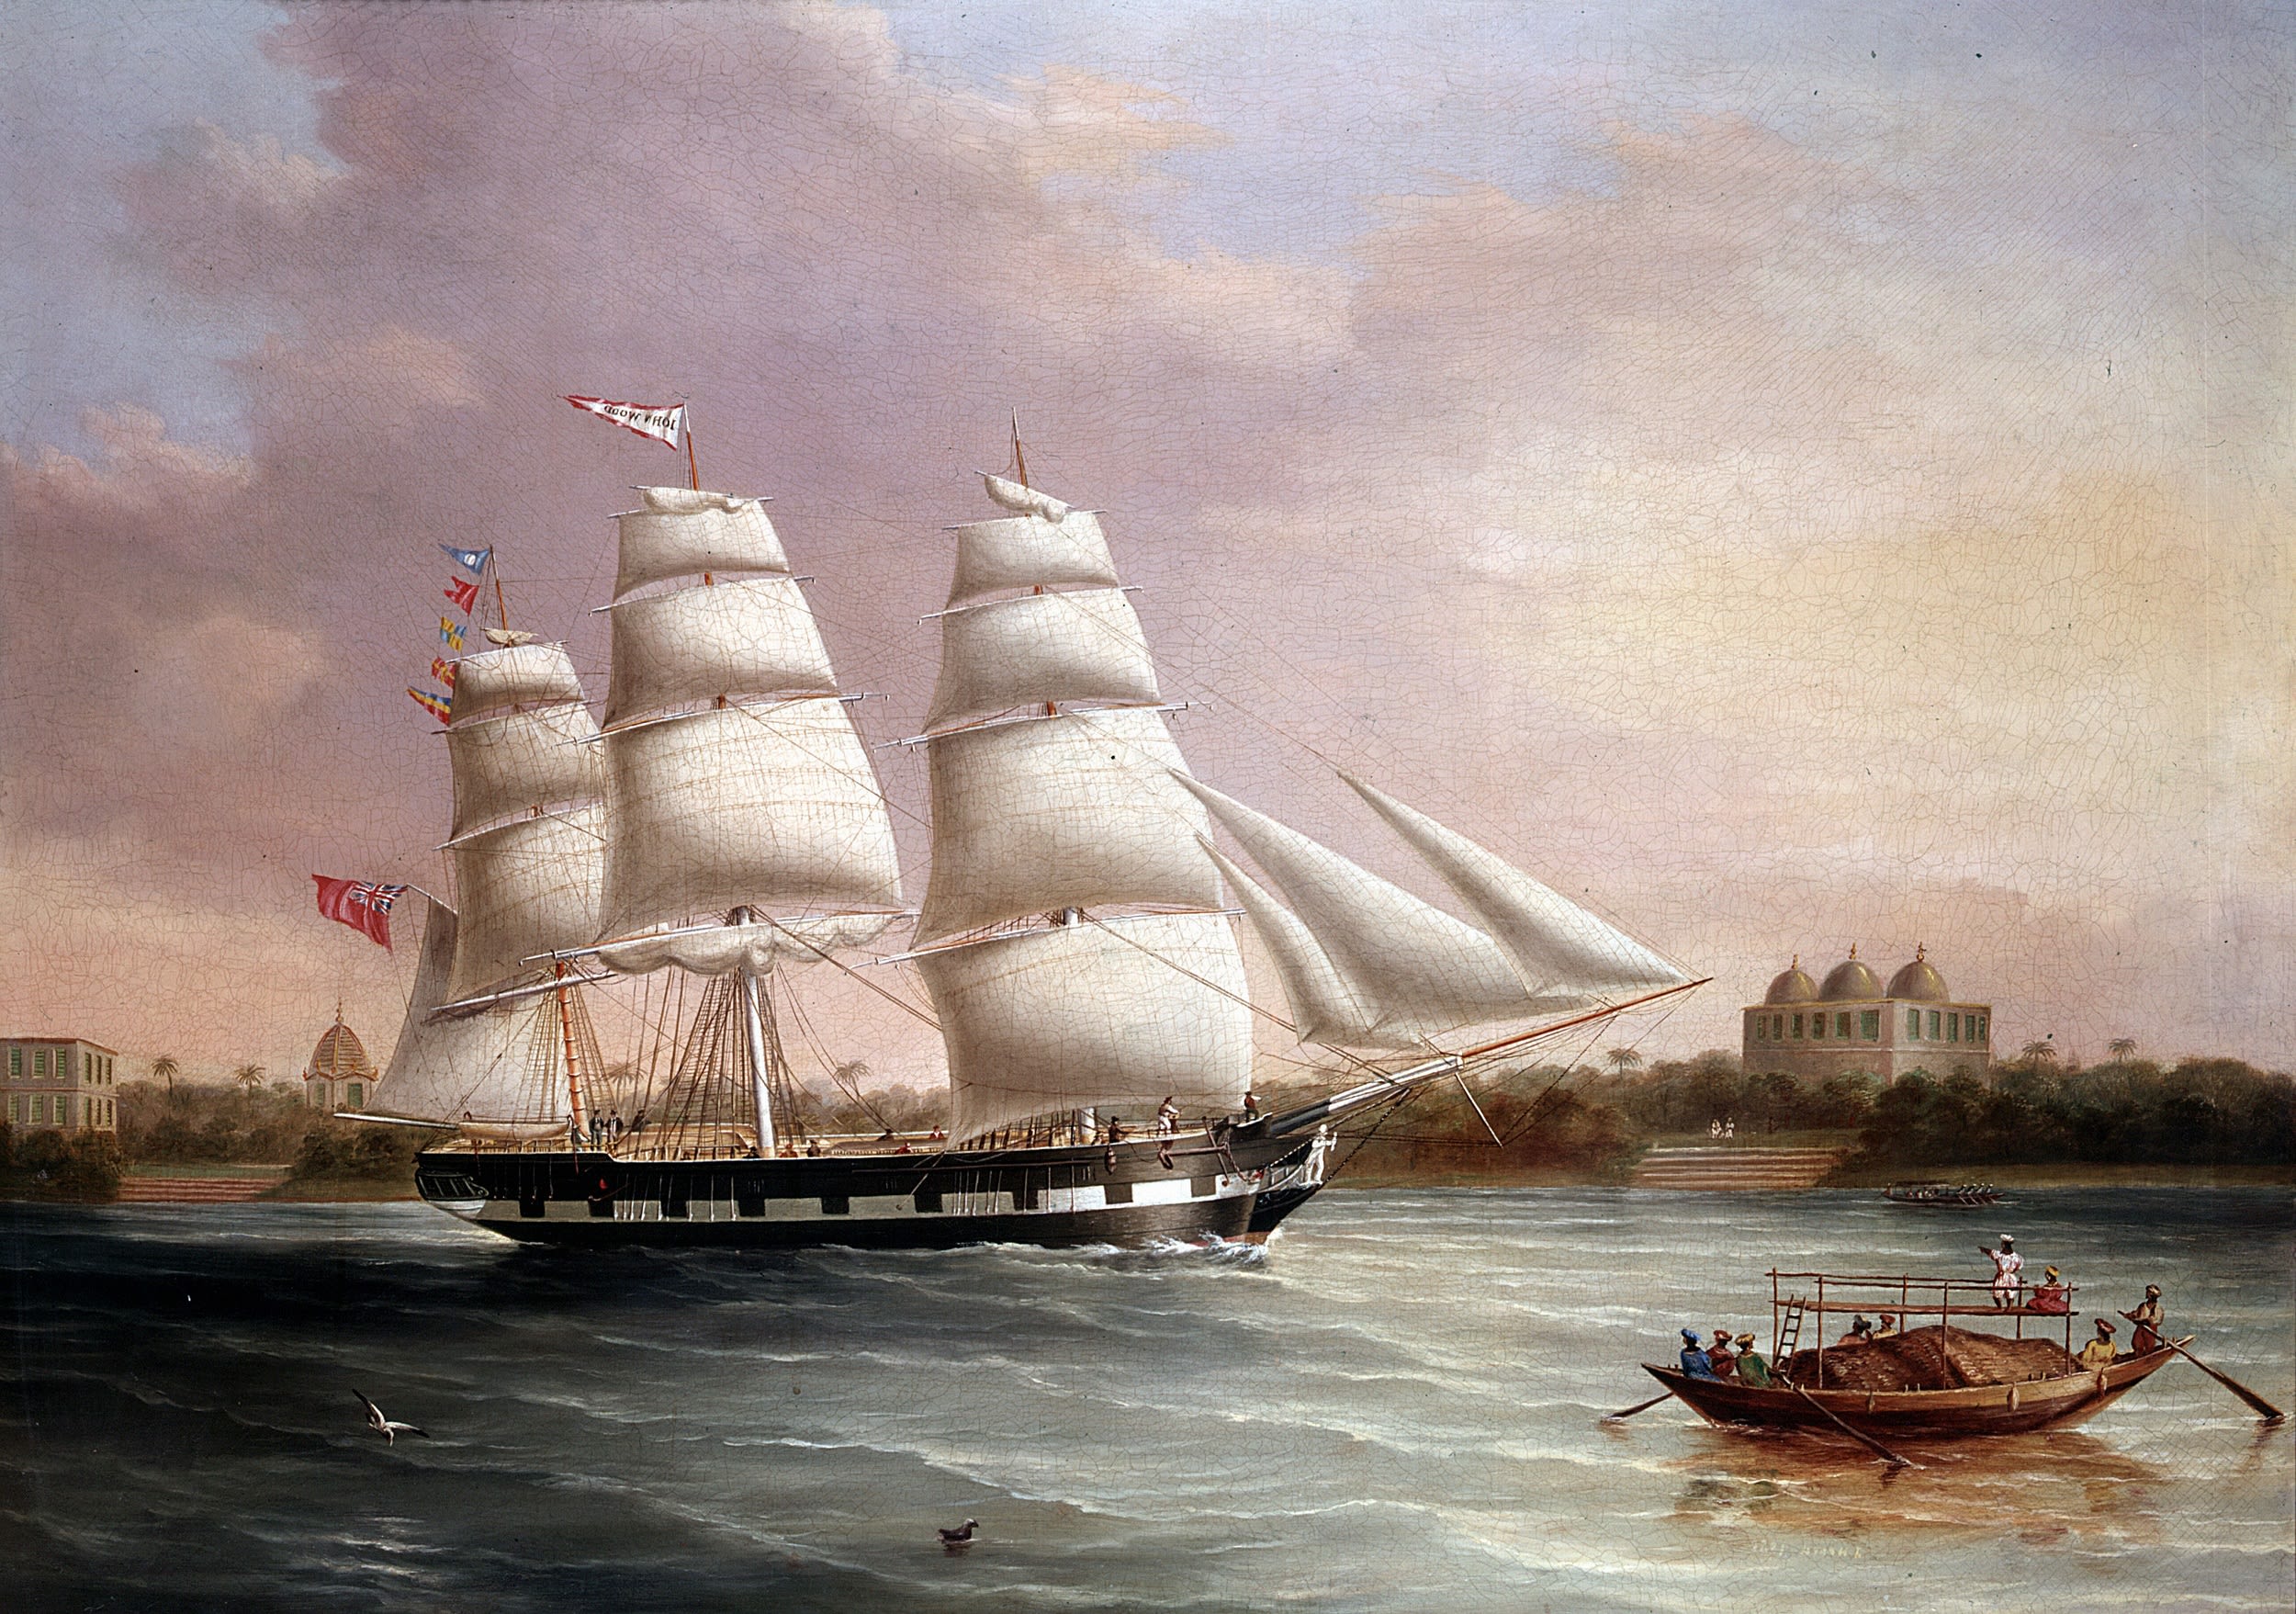
After the Middle Ages, Britain’s developing global connections as an aggressive imperial and commercial power led millions of its people to migrate elsewhere in the world, and eventually brought new settlers to Britain. As in the time of the first settlers, changing political, economic or climatic circumstances have kept people in restless movement – unsettled – as they seek new opportunities, or try to escape famine, persecution or war.
At the same time, mostly stimulated by the Industrial Revolution of the 18th and 19th centuries, people became much more likely to move from their birthplaces to other parts of the British Isles: from the countryside to cities, from Ireland, Scotland and Wales to England, from the north to the south.
When people move and mix, patterns of genetic variation become more complicated, but genetic links to geography persist through the generations.

Changing world, changing lives
What drove the first people to come to Britain? Some moved because new opportunities arose, such as the expanding area for hunting revealed as the ice retreated. Some, such as the Anglo-Saxons, may have moved because it was less risky to leave than to stay where they were. Some, including the Vikings, followed leaders who were hungry for territorial conquest.
Broadly speaking, the same reasons have driven people to move ever since. Improvements in methods of transport, from sailing ships, roads, railways and canals to ocean liners, motor vehicles and aircraft, have greatly increased mobility both within and between countries. Global political and economic changes have sent people from Britain all over the world, and brought new settlers in their turn.

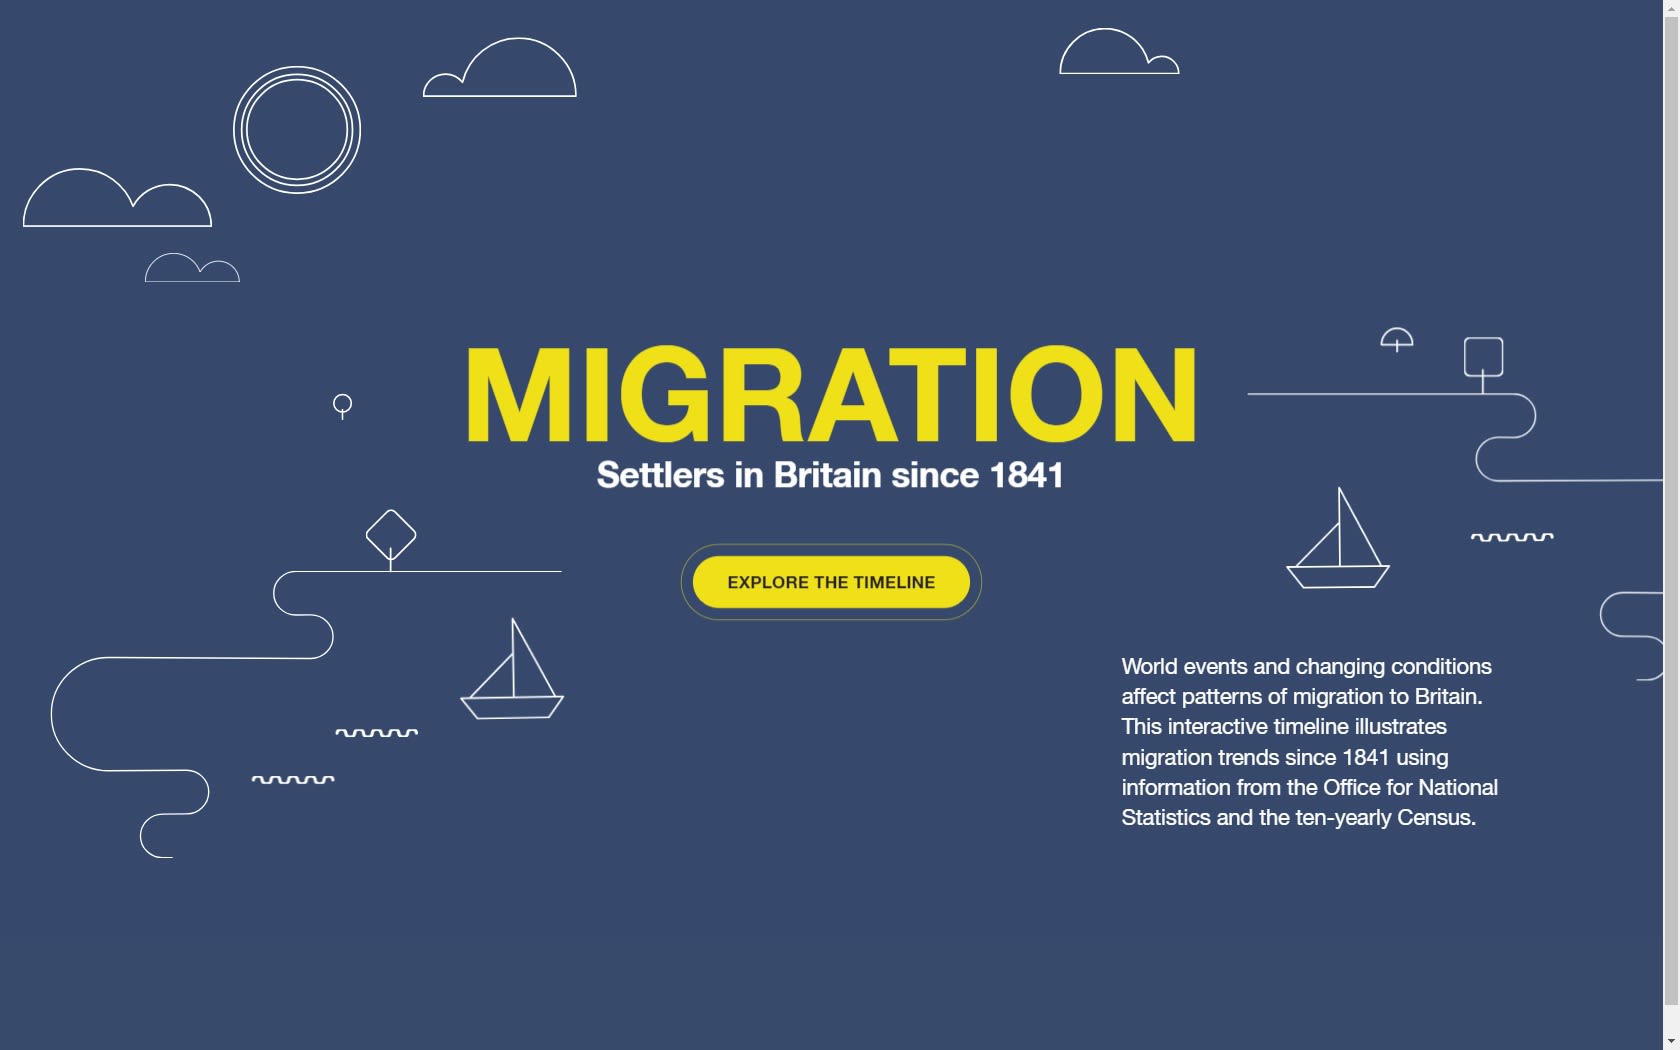
World events and changing conditions affect patterns of migration to Britain. Click above to open an interactive timeline to see trends since 1841. This interactive is not designed for mobile devices and is best viewed on desktop in latest version of Chrome or Firefox.
World events and changing conditions affect patterns of migration to Britain. Click above to open an interactive timeline to see trends since 1841. This interactive is not designed for mobile devices and is best viewed on desktop in latest version of Chrome or Firefox.


Building cities
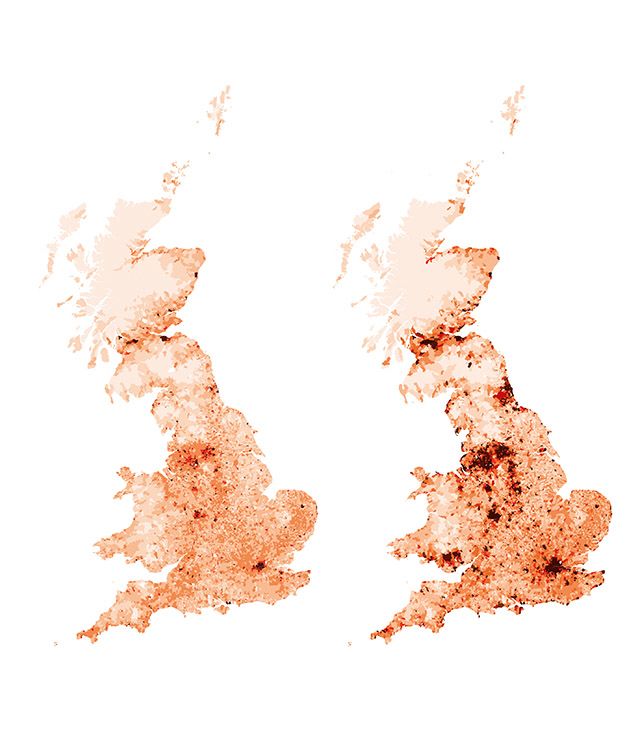
Left map: 1801; right map: 1891. These maps show that the density of the population in England and Wales increased in urban areas across the 19th century, as people moved to the cities to find employment in factories. Source: Cambridge Group for the History of Population and Social Structure
People who lived and worked in the countryside remained largely settled in the same places for hundreds of years, until the end of the 18th century. Between 1750 and 1850 agricultural activity became more productive and needed less labour, the population trebled from 5.7 million to 16.6 million, and the new factories of the Industrial Revolution needed thousands of workers.
So began a movement from the country to the cities: Liverpool, Birmingham, Manchester, Leeds and above all London greatly increased their populations. Even though the national population was rising, the pull of the cities was such that the number of people living in rural communities actually fell.
A painstaking study of almost 74,000 journeys recorded in the family histories of 16,000 individuals between 1890 and 1995 paints a picture of changing patterns of movements within Britain. In the 18th and 19th centuries rural areas lost people as they moved into the growing cities and urban areas, but by the end of the 19th century and into the 20th this pattern began to reverse.
The 1930-1995 map - on the right hand side - shows how major cities began to lose people through migration, while other areas gained.
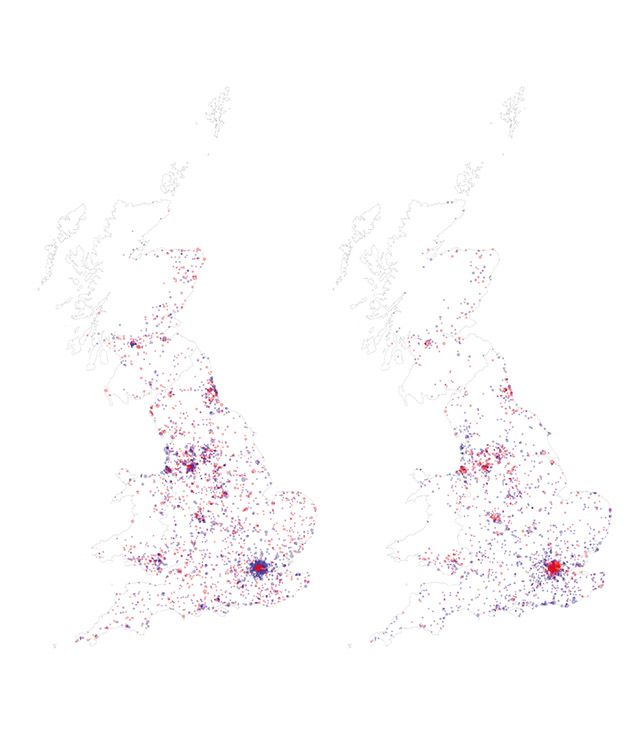
Left map: 1890-1930; right map: 1930-1995. Blue: population gain through migration; red: population loss through migration; grey: zero net migration. Source: Colin Pooley and Jean Turnbull's 1995 ESRC-funded project ‘The Longitudinal Study of Residential Histories’

Left map: 1801; right map: 1891. These maps show that the density of the population in England and Wales increased in urban areas across the 19th century, as people moved to the cities to find employment in factories. Source: Cambridge Group for the History of Population and Social Structure
Left map: 1801; right map: 1891. These maps show that the density of the population in England and Wales increased in urban areas across the 19th century, as people moved to the cities to find employment in factories. Source: Cambridge Group for the History of Population and Social Structure
Left map: 1890-1930; right map: 1930-1995. Blue: population gain through migration; red: population loss through migration; grey: zero net migration. Source: Colin Pooley and Jean Turnbull's 1995 ESRC-funded project ‘The Longitudinal Study of Residential Histories’
Left map: 1890-1930; right map: 1930-1995. Blue: population gain through migration; red: population loss through migration; grey: zero net migration. Source: Colin Pooley and Jean Turnbull's 1995 ESRC-funded project ‘The Longitudinal Study of Residential Histories’

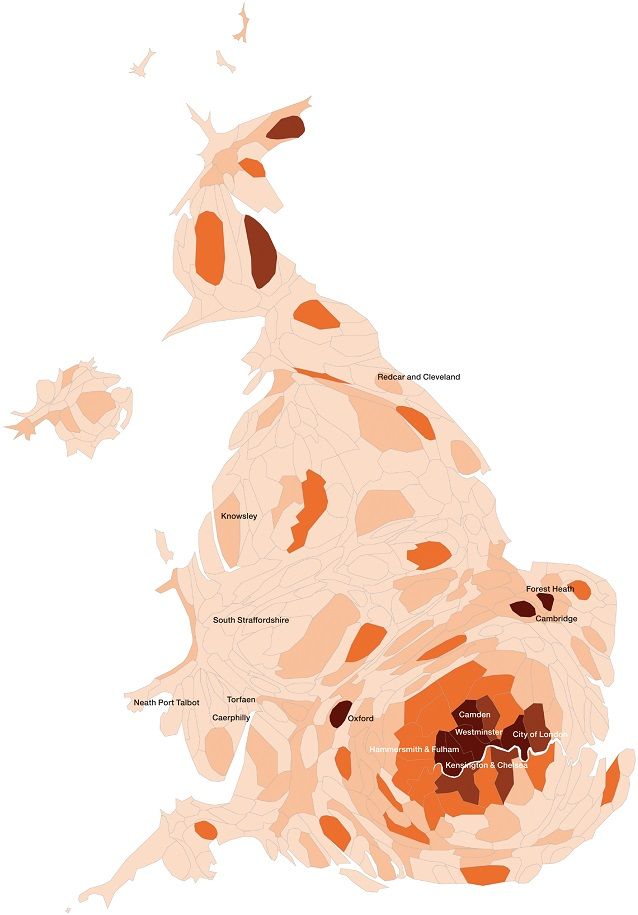
In this ‘Dorling cartogram’, based on data from the 2011 census, the area of each local authority region in England and Wales is distorted to represent the size of its population. Each is then coloured according to the number of people who moved to the UK within the previous year. Source: People and Places: A 21st century atlas of the UK by Danny Dorling and Bethan Thomas, Policy Press 2016
In this ‘Dorling cartogram’, based on data from the 2011 census, the area of each local authority region in England and Wales is distorted to represent the size of its population. Each is then coloured according to the number of people who moved to the UK within the previous year. Source: People and Places: A 21st century atlas of the UK by Danny Dorling and Bethan Thomas, Policy Press 2016
Who are we now?
Britain in the 21st century reflects continuing patterns of population movements into, out of and within Britain. In a globalised and technologically connected world, it has become much easier to move than it was for our ancestors. The percentage of people in the UK who were born outside Britain has increased, as well as of those born in Britain now living overseas.
In this ‘Dorling cartogram’, based on data from the 2011 census, the area of each local authority region in England and Wales is distorted to represent the size of its population. Each is then coloured according to the number of people who moved to the UK within the previous year. Source: People and Places: A 21st century atlas of the UK by Danny Dorling and Bethan Thomas, Policy Press 2016
However, the pattern of settlement by new arrivals is very uneven: most migrant communities live in towns and cities. Urban settlements are most likely to attract those coming to work or study.
Migration is a key factor in keeping population numbers stable. Currently the birth rate in the UK is falling, while people are living longer, so the working age population would fall without new arrivals: this may be a particular problem in areas with low migration.
What are the most important factors affecting the population of Britain today?
Ask your genes
The population movements of the past 500 years have made the people of Britain much more genetically diverse than they were in the Middle Ages. The cost of reading whole human genomes has fallen dramatically since the technology was first developed in the 1990s, and scientists are building databases of genetic patterns linked to all parts of the world.
Patterns of genetic variation may help individuals to trace their family histories. Collecting genetic data on a large scale is also now a key part of modern biomedical science, enabling doctors to link genetic variation with the risk of a wide range of diseases.

Meet the ancestors
The People of the British Isles study showed for the first time that genetic analysis could distinguish some British people living today in a way that reflected their early origins in the British Isles. Similar methods can link anyone to locations around the country or the world where they have relatives who share the same distinctive genetic patterns.
We all carry mixtures of genes that reveal ancestry from across the world. Our individual DNA profile is the outcome of the way our ancestors have moved, settled, mixed and moved again for centuries.

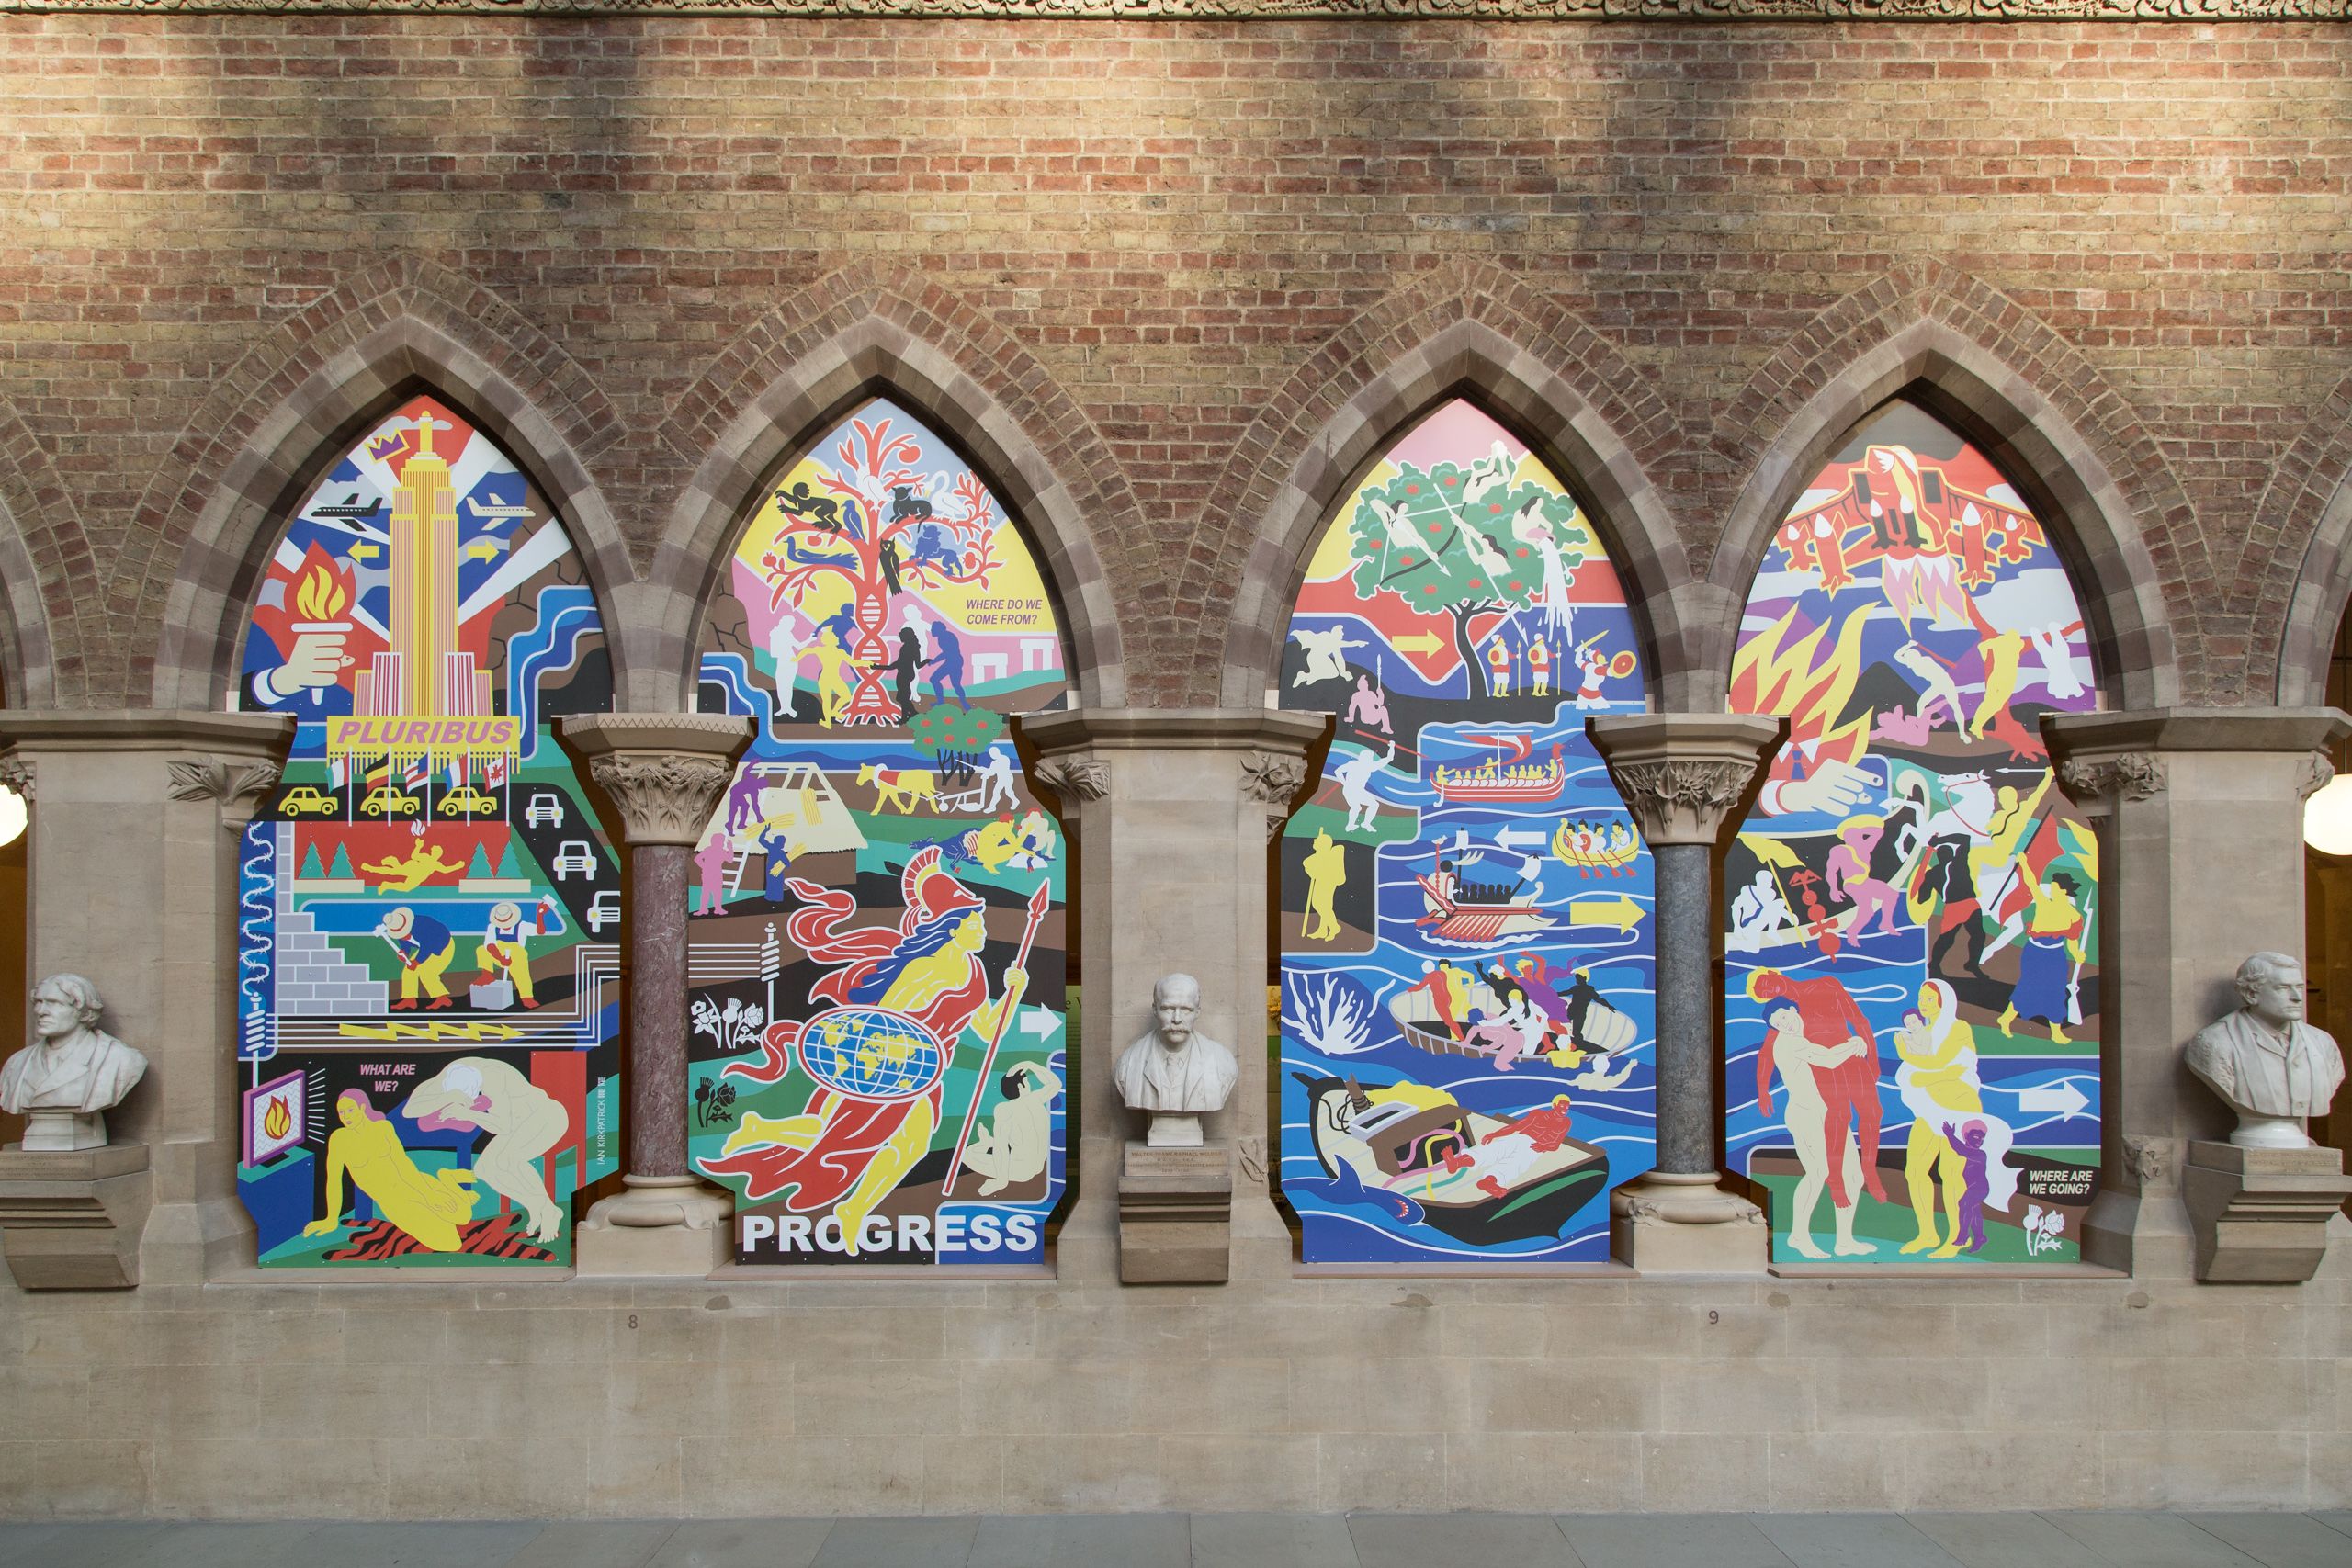
Where Do We Come From? What Are We? Where Are We Going? by Ian Kirkpatrick. This artwork was commissioned as part of the Settlers exhibition and can be seen on display in the main court of the museum, 9 February - 16 September 2018. It explores the social and natural causes behind human migration, both in ancient times and in the present day.
Where Do We Come From? What Are We? Where Are We Going? by Ian Kirkpatrick. This artwork was commissioned as part of the Settlers exhibition and can be seen on display in the main court of the museum, 9 February - 16 September 2018. It explores the social and natural causes behind human migration, both in ancient times and in the present day.
Settlers event programme
A varied programme accompanies the Settlers exhibition, featuring events and activities for visitors of all ages.

Content © Oxford University Museum of Natural History / University of Oxford unless stated otherwise